Rule 1.4 · one of 47IF succession_type = "family" AND successor_experience < 36 monthsTHEN Family Succession Pathway · extended prep track
The Family Succession Owner25–30% of owners · Timeline: 2–7 years · Age: 60+
UX case study · PNC Bank · 2020
Business Owner Succession Simplified.
PNC asked for a content portal. Research showed owners didn’t need more to read; they needed to know how ready they were and who to talk to. I turned advisors’ judgment into 47 rules owners could run themselves, and client engagement went from 35% to 86%.
Four succession personasFamily Succession OwnerStrategic SellerESOP Business OwnerSudden Exit Founder
86%Client engagement increase
236%Engagement rate improvement
$1.5MAdditional annual revenue
+67NPS score improvement
RoleSr. UX Designer & Solution Architect
CompanyPNC Bank
Timeline6 Months · 2020
TeamPM · Engineering Lead · 8 Succession Advisors
Algorithm47 Codified Business Rules
Executive summary
The ask was a succession-planning content portal. Research showed 78% of owners had enough information, but only 31% knew which exit option fit. I reframed it as a personalized assessment engine, translating advisor expertise into 47 business rules to clarify readiness, exit paths, and advisor fit. Engagement rose from 35% to 86%, advisor mismatch fell from 67% to 18%, and the bank gained $1.5M annually.
86%client engagement with succession services, from 35%
18%advisor-client mismatch rate, from 67%
2 wksto first engagement, from 6.2 weeks
$1.5Madditional annual revenue
At a glance
Challenge
PNC's Succession Advisory team asked for a password-protected content portal. Owners arrived too late, met the wrong advisor, and only 17% of first consultations led to immediate forward progress.
Solution
A rule-based assessment engine: 47 codified rules, two-dimensional readiness scoring across 9 zones, persona routing, personalized action plans and advisor matching. Owners left with a plan, and the PNC specialist they were matched with arrived already briefed.
My role
Led discovery: 13 advisor interviews, 6 owner interviews, 89 survey responses and 12 shadowed consultations. Ran four rule workshops with eight advisors. Team: PM, engineering lead, 8 succession advisors.
Most business owners spend decades building something — then face one of the most complex financial and legal decisions of their lives with almost no structured guidance. Succession planning is how you exit: sell to a strategic buyer, transfer to family, set up an ESOP, or hand off to management. Each path has different tax implications, different timing requirements, different advisors. Get it wrong and you leave significant value on the table, or worse, hand the business off too late to matter. PNC Bank had a team of specialists who navigated this for clients. The problem was getting the right owner to the right advisor at the right moment — before it became an emergency.
01.2How I Read the Brief
What I Was Handed
PNC Bank's Succession Advisory team handed me a scoped request: design a password-protected content portal for business owners planning succession. The brief was clear, the stakeholders were aligned, and the build timeline was defined. I had one question before accepting the scope: has anyone validated that an information portal is actually what owners need?
What I was given
A defined solution
Portal with articles, videos, and guides. Stakeholder hypothesis: owners weren't planning succession because they lacked education and awareness.
What made me pause
No validated problem
The brief described a solution — not a validated failure mode. Low engagement had been observed, but the cause had been assumed, not researched. That gap warranted three weeks of discovery before any design work.
My initial read
The problem might be upstream
Succession planning is a high-stakes, deeply personal decision. Information overload seemed more plausible than information scarcity. I flagged this with the PM before committing to the portal direction.
01.3The Pivot
The Challenge That Wasn't
The bank's Succession Advisory team came in with a clear request: build a password-protected portal where business owners could learn about succession planning. On paper, that sounded reasonable. In practice, it was aimed at the wrong failure point. Owners were not struggling because content was unavailable. They were struggling because the decision itself was complex, emotional, high-stakes, and deeply situational.
✕ What They Asked For
A Password-Protected Information Portal
✕Articles, videos and guides about succession options
✕Timeline explanations and best practices content
✕Build awareness to encourage consultations
Their hypothesis: Business owners were unaware of succession services. Leadership believed the problem was lack of education and awareness.
✓ What We Actually Built
A Rule-Based Algorithmic Decision Engine
✓47 algorithmic business rules codifying advisor expertise
✓4-dimension business readiness assessment (0–100)
✓4 succession personas with smart routing
✓Personalized, prioritized action plans with timelines
✓Advisor matching based on assessment outcome
The pivot: The problem wasn't lack of information — it was lack of personalized, actionable guidance.
The Strategic Pivot
Through systematic UX research, I uncovered the real problem and proposed a rule-based algorithmic decision engine instead. Research showed 78% of business owners already had enough information — but only 31% knew which option applied to their specific situation. That gap mattered. It meant the real barrier was not awareness, but clarity: which path fits, how ready am I, what should I do first, and when should I speak to an advisor? A portal would have added more content to an already overloaded decision. The product needed to reduce ambiguity, not increase reading.
How impact was measuredPerformance was measured post-launch using engagement analytics, assessment completion data, advisor-routing outcomes, algorithm validation against historical cases, and revenue attribution tied to succession-service engagement. Some commercial figures are rounded for confidentiality.
02Chapter 02 of 06
Discovery
Information was never the problem. This was a decision support problem, not an education problem.
Validated the Problem Through Systematic UX Research
Before committing to anything, I needed to know whether a content portal would actually solve the problem — or just look like it did. Three weeks of discovery inside a six-month engagement. Advisor interviews, owner interviews, a survey, process shadowing. The goal wasn't to validate the brief. It was to find out if the brief was right.
Objective 01
Understand why business owners aren't engaging with succession planning
Objective 02
Validate whether "lack of education" is truly the barrier
Identify what would actually motivate owners to take action
Objective 03
Discover where technology could simplify
Explore how advisors qualify and segment business owners
Phase 01
Succession Advisory Team Interviews
13 interviews · 60 minutes each · Semi-structured format
Phase 02
Business Owner Interviews & Survey
6 business owner interviews · Likert scale survey · 89 responses from business banking clients (age 50+, businesses 10+ years old)
"60–70% of first meetings end with me realizing they're not ready yet or they need a different type of advisor than me."
Insight #1: Qualification and routing problem, not education problem
Advisor 2 · M&A Specialist, 10 yrs
"I'm basically running through a mental checklist: revenue, profitability, customer concentration, processes... I'm evaluating 20–30 different factors."
Insight #2: Complex assessment algorithm exists in advisors' heads
Advisor 3 · Family Business, 12 yrs
"Family succession is completely different from a strategic sale. Clients don't understand these distinctions."
Insight #3: 4 distinct pathways require different expertise
Critical Insights from Advisor Interviews
Problems identified: Owners arrive too late · Unrealistic expectations about business value · RMs lack assessment framework · High mismatch rate between owners and advisors · No systematic approach to readiness evaluation. Emerging hypothesis: Need assessment tool, not just education · Timing and readiness are key factors · Qualification process could improve outcomes · Advisors have tacit knowledge to codify · Personalization might drive engagement.
Research Phase 2
Business Owner Interviews and Survey
Owner 1 · Manufacturing, 30 yrs, Age 58
"I've been thinking about retirement for 5 years, but keep putting it off. I know succession planning exists, but don't know where to start with MY business."
Cognitive Overload
Business owners knew of succession planning but couldn't process the volume or relevance of available information. They needed simplified, sequential decision paths.
Owner 2 · Family Restaurant, 25 yrs, Age 63
"I thought I was prepared to hand over the business to my daughter. But the advisor asked questions I couldn't answer. I realized I had no idea what I was doing."
Choice Paralysis
Owners didn't need more content; they needed clarity on what to do next and confidence that they were moving toward the right goal.
Owner 3 · Construction Firm, 20 yrs, Age 65
"I went to three advisors — one said sell, one said ESOP, one said transfer to management. I left more confused than when I started."
Fragmented User Experience
Disconnected tools, inconsistent advice. Users needed one unified ecosystem that simplified advisor perspectives into one clear, guided recommendation engine.
Owner 4 · Technology Consulting, 15 yrs, Age 55
"I had a health scare last year and realized I might need to exit in 6 months. But everything I found was written for people with years to plan — nothing applied to me."
Lack of Trust & Engagement
Rigid tools didn't adapt to urgency or personal context. Users disengaged when tools felt "too corporate" or irrelevant to their immediate situation.
Top Challenges — Survey (89 Responses)
Likert scale survey sent to business banking clients (age 50+, businesses 10+ years old)
Don't know where to start43%
Can't assess if business is ready36%
Don't know which option is right31%
Overwhelmed by complexity27%
Don't know business worth25%
Lack of information9%
"Lack of information" ranks LAST at 9%. Top challenges are all about assessment, decision-making, and personalized guidance — not education.
Key Finding: Information ≠ Decision Confidence
78%
have enough information about succession options
31%
know which option is right for their business
87%
would use a personalized assessment tool — significantly more valuable than general content
Critical Insight
Information isn't the problem. This is a decision support problem, not an education problem.
Research Phase 3
Process Shadowing & Decision Mapping — Understanding exactly how advisors make qualification decisions through direct observation of 12 consultation sessions.
13
Sessions observed
Every
Question documented
All
Decision points noted
4
Patterns identified
Pattern 1
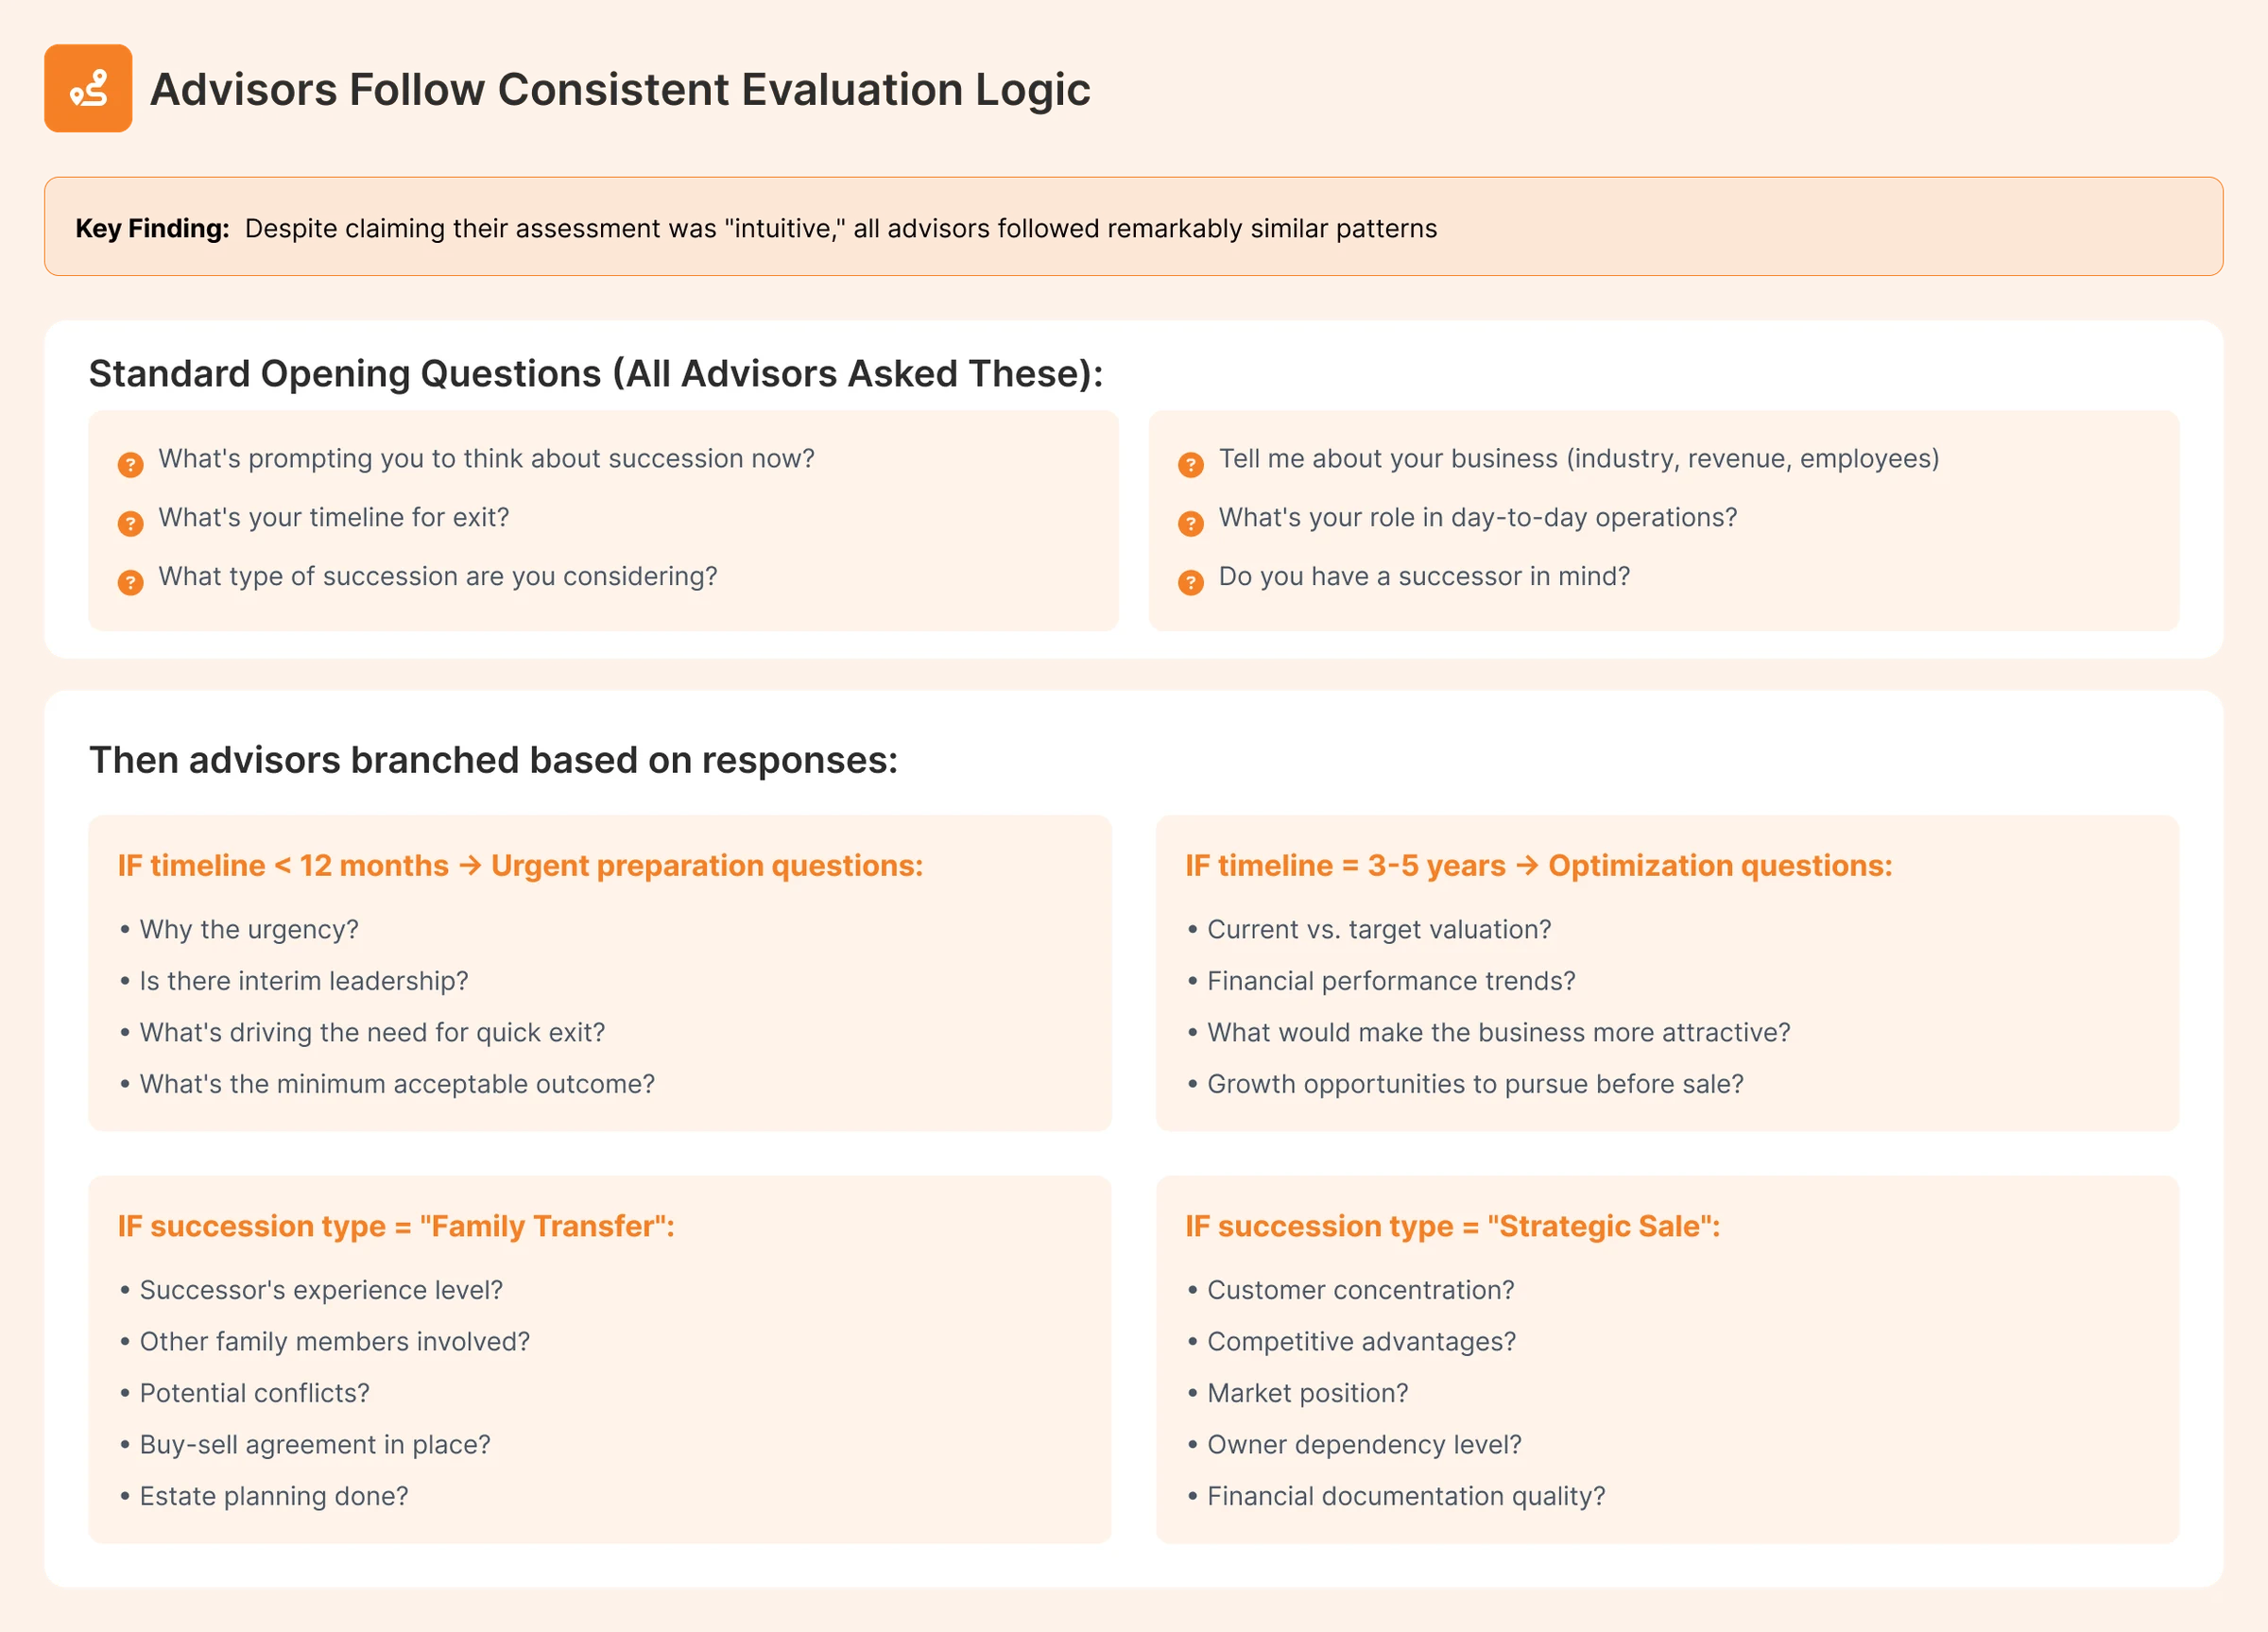
Advisors Follow Consistent Evaluation Logic
Despite claiming their assessment was "intuitive," all advisors followed remarkably similar patterns. Standard opening questions (all advisors asked): What's prompting you to think about succession now? Tell me about your business. What's your timeline for exit? What's your role in day-to-day operations? What type of succession are you considering? Do you have a successor in mind?
→ Then advisors branched based on responses using IF/THEN logic
Pattern 2
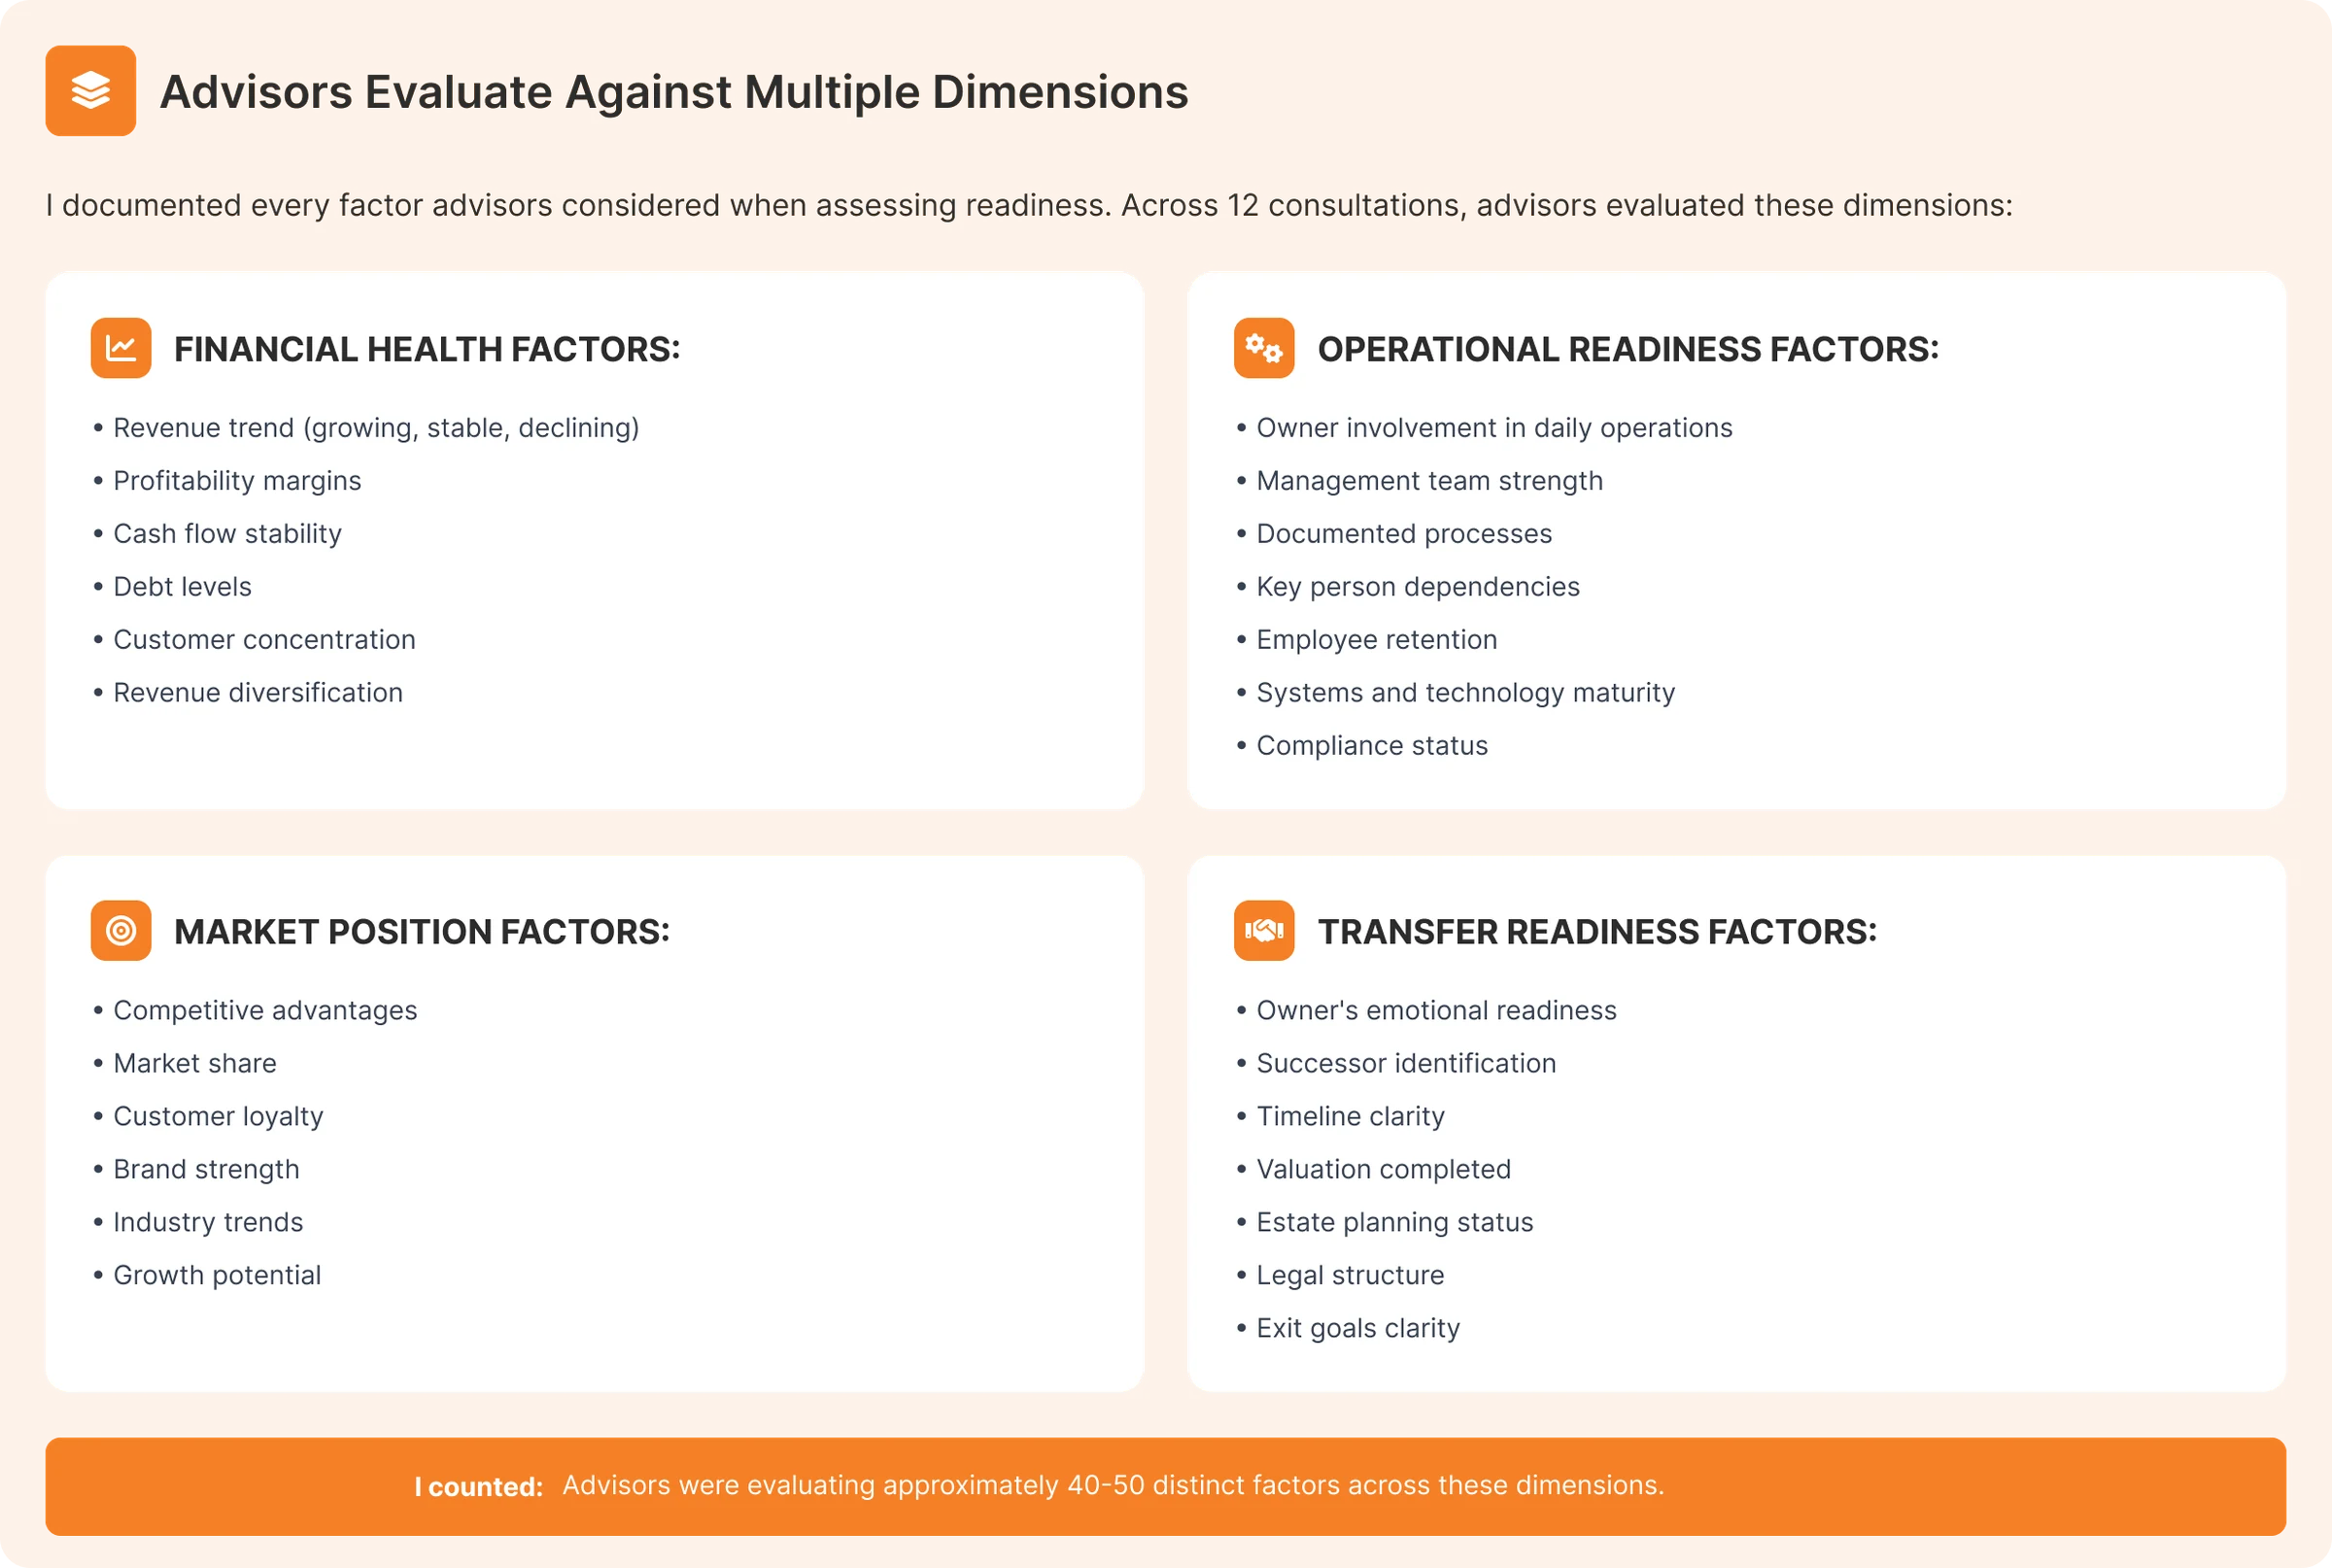
Advisors Evaluate Against Multiple Dimensions
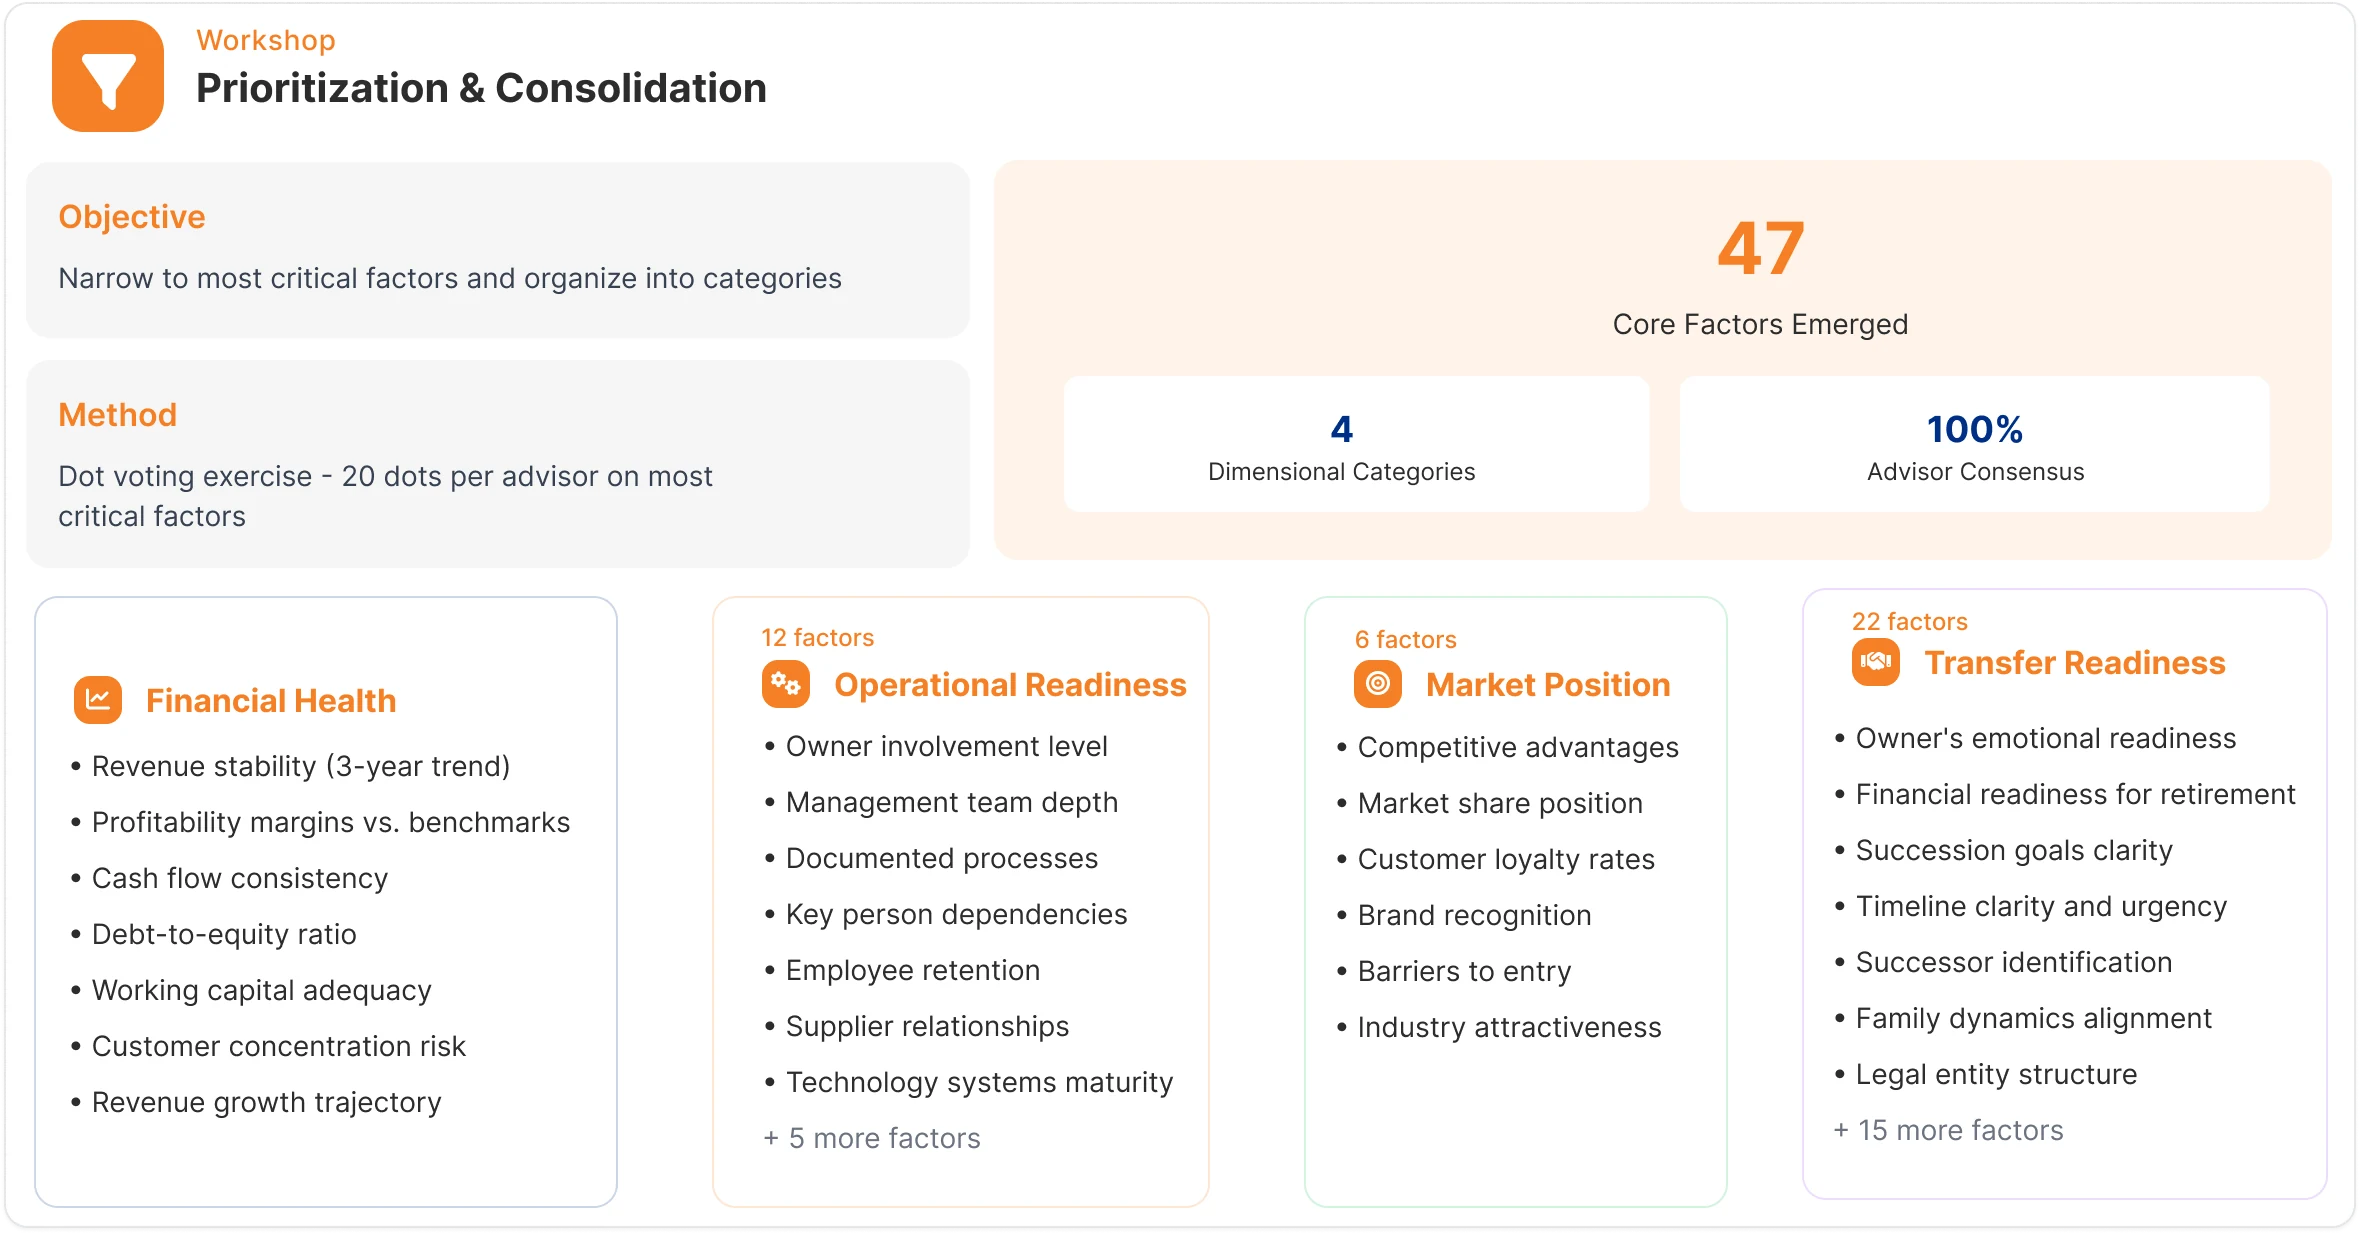
Advisors were evaluating approximately 40–50 distinct factors across 4 dimensions: Financial Health (revenue trend, profitability, cash flow, debt levels, customer concentration, revenue diversification), Operational Readiness (owner involvement, management team, documented processes, key person dependencies, employee retention, systems maturity), Market Position (competitive advantages, market share, customer loyalty, brand strength, industry trends), Transfer Readiness (emotional readiness, successor ID, timeline clarity, estate planning).
Pattern 3
The Mismatch Problem Is Quantifiable
Out of 12 consultations observed: 8 consultations = "You're not quite ready yet. Here's what you need to work on." 2 consultations = "You actually need to talk to a different advisor type." 2 consultations = "Great, you're ready. Let's move forward."
→ Only 17% of initial consultations resulted in immediate forward progress
Pattern 2 — 40–50 factors documented across 4 dimensions during 12 shadowed consultations
Pattern 3 — Only 17% of initial consultations resulted in immediate forward progress
Common Mismatch Scenarios Observed
Scenario A · Family Succession — Successor Experience Gap
Owner wantedTransfer to daughter
Advisor askedHow long has she worked in the business?
AnswerAbout 18 months.
Advisor outcome"She needs at least 2–3 years of experience before you can transfer. You're not ready yet."
Scenario B · Strategic Sale — Customer Concentration Risk
Owner wantedSell for $5M
Business had80% revenue from one customer
Advisor outcome"No buyer will pay full value with that concentration risk. You need to diversify first — that's 12–18 months of work minimum."
ImpactAttractiveness score reduced 15 points
Scenario C · Family Succession — Missing Estate Planning
Owner wantedFamily succession
Gap foundNo estate planning completed
Advisor outcome"We can't structure the transfer without knowing the estate plan. You need to work with an estate attorney first, then come back."
LearningLegal structure is a gate, not an optional factor
Critical Insight — Process Shadowing
Advisors are executing decision tree algorithms. Their questions follow IF/THEN logic that branches based on user responses. This logic can be codified. Succession readiness is multi-dimensional — it's not one score but evaluation across at least 4 major categories with 10–15 factors each. This complexity is why owners can't self-assess accurately.
02.2Research Phase 4
Understanding Distinct Succession Personas
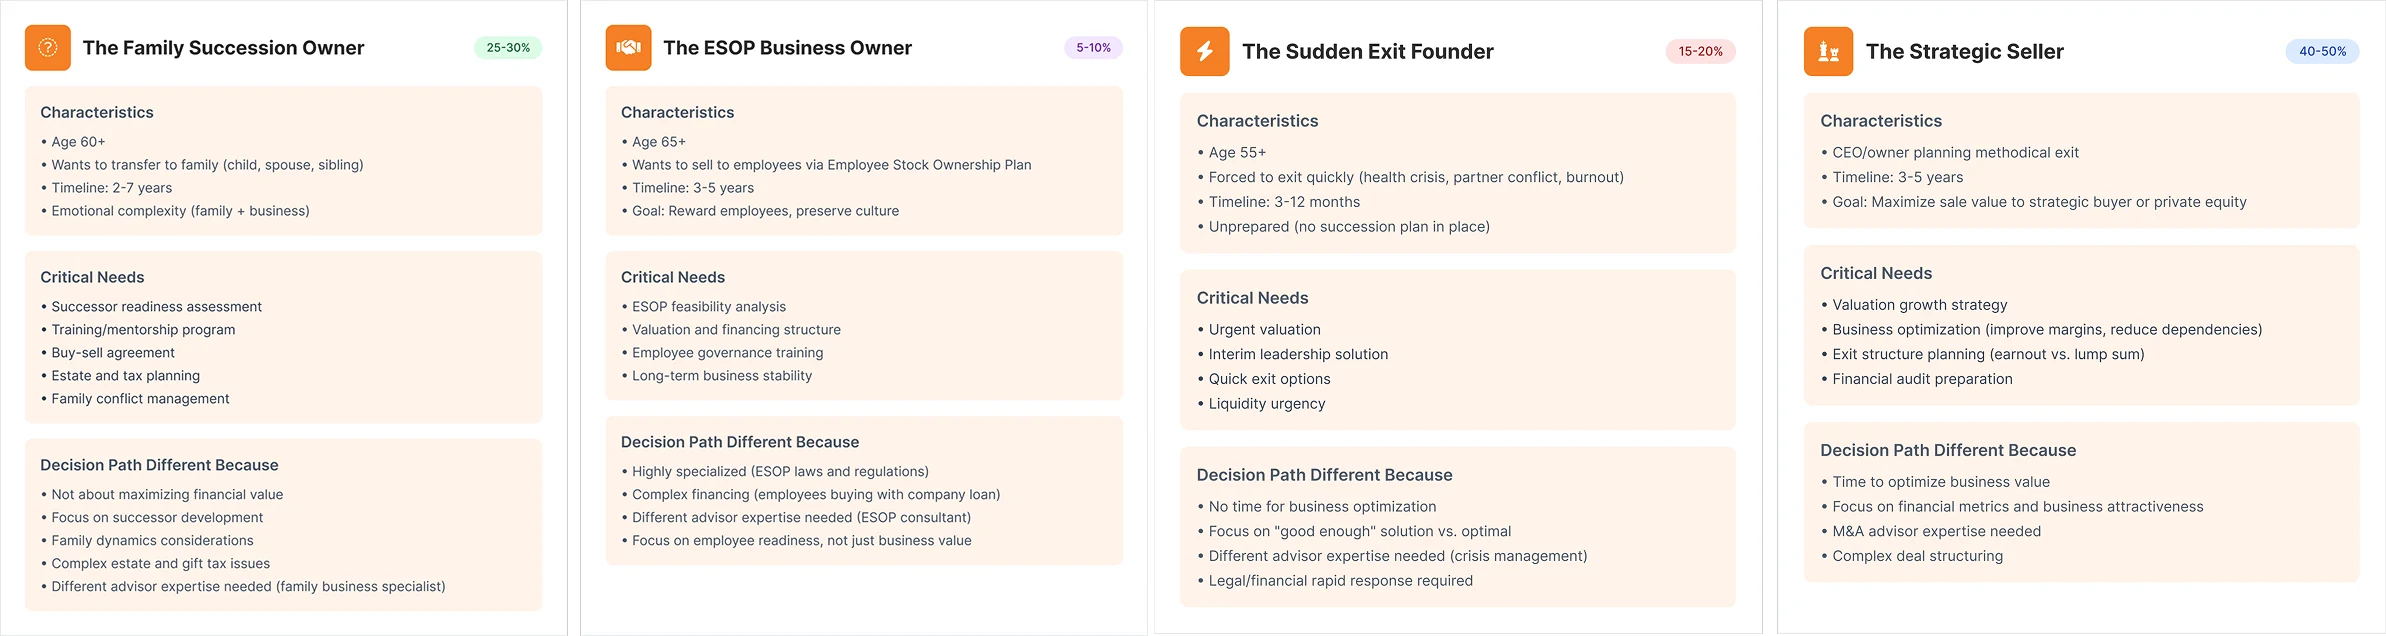
From shadowing and interviews, I identified that succession planning conversations followed 4 very distinct patterns based on the owner's situation. These 4 personas require completely different evaluation criteria, advisor expertise, and action plans. A one-size-fits-all portal wouldn't address their unique needs — but a rule-based assessment could route each persona to the appropriate pathway.
40–50%
The Strategic Seller
Timeline: 3–5 years · Age: CEO/owner
Planning methodical exit. Goal: maximize sale value to strategic buyer or private equity.
Critical Needs
Valuation growth strategy
Business optimization (improve margins, reduce dependencies)
Exit structure planning (earnout vs. lump sum)
Financial audit preparation
Decision path different because: Time to optimize business value · Focus on financial metrics and business attractiveness · M&A advisor expertise needed · Complex deal structuring
25–30%
The Family Succession Owner
Timeline: 2–7 years · Age: 60+
Wants to transfer to family (child, spouse, sibling). Emotional complexity of combining family and business.
Critical Needs
Successor readiness assessment
Training and mentorship program
Buy-sell agreement
Estate and tax planning
Family conflict management
Decision path different because: Not about maximizing financial value · Focus on successor development · Complex estate and gift tax issues · Family dynamics considerations
15–20%
The Sudden Exit Founder
Timeline: 3–12 months · Age: 55+
Forced to exit quickly (health crisis, partner conflict, burnout). Unprepared, no succession plan in place.
Critical Needs
Urgent valuation
Interim leadership solution
Quick exit options mapped
Liquidity urgency planning
Decision path different because: No time for business optimization · Focus on "good enough" vs. optimal solution · Different advisor expertise (crisis management) · Legal/financial rapid response
5–10%
The ESOP Business Owner
Timeline: 3–5 years · Age: 65+
Wants to sell to employees via Employee Stock Ownership Plan. Goal: reward employees, preserve culture.
Critical Needs
ESOP feasibility analysis
Valuation and financing structure
Employee governance training
Long-term business stability planning
Decision path different because: Highly specialized ESOP laws and regulations · Complex financing (employees buying with company loan) · Different advisor expertise (ESOP consultant) · Focus on employee readiness
02.3Research Synthesis
The 5 Whys Workshop
I ran a workshop with the product team using the 5 Whys technique to get to the root cause — tracing from symptom to structural problem. This became the strategic justification for the pivot.
WHY 1
Why are business owners not engaging with succession planning?
Because they don't know where to start.
WHY 2
Why don't they know where to start?
Because they can't assess their own readiness and don't know which path is right for them.
WHY 3
Why can't they assess their own readiness?
Because readiness evaluation requires expertise across 40–50 factors that owners don't have.
WHY 4
Why don't they know which path is right for them?
Because different succession types require different evaluation criteria and they lack a framework to determine fit.
WHY 5
Why is there no framework?
Because advisor expertise exists only in their heads — it's tacit knowledge that hasn't been codified into an accessible system.
Root Cause
The gap isn't information — it's codified decision-making expertise. Advisors have complex evaluation algorithms in their heads. Owners and RMs need access to that algorithmic thinking before they meet with advisors. The solution: a system that asks the right questions, evaluates against expert criteria, identifies specific readiness gaps, prioritizes what to work on first, determines which succession pathway fits, and routes to the right advisor at the right time.
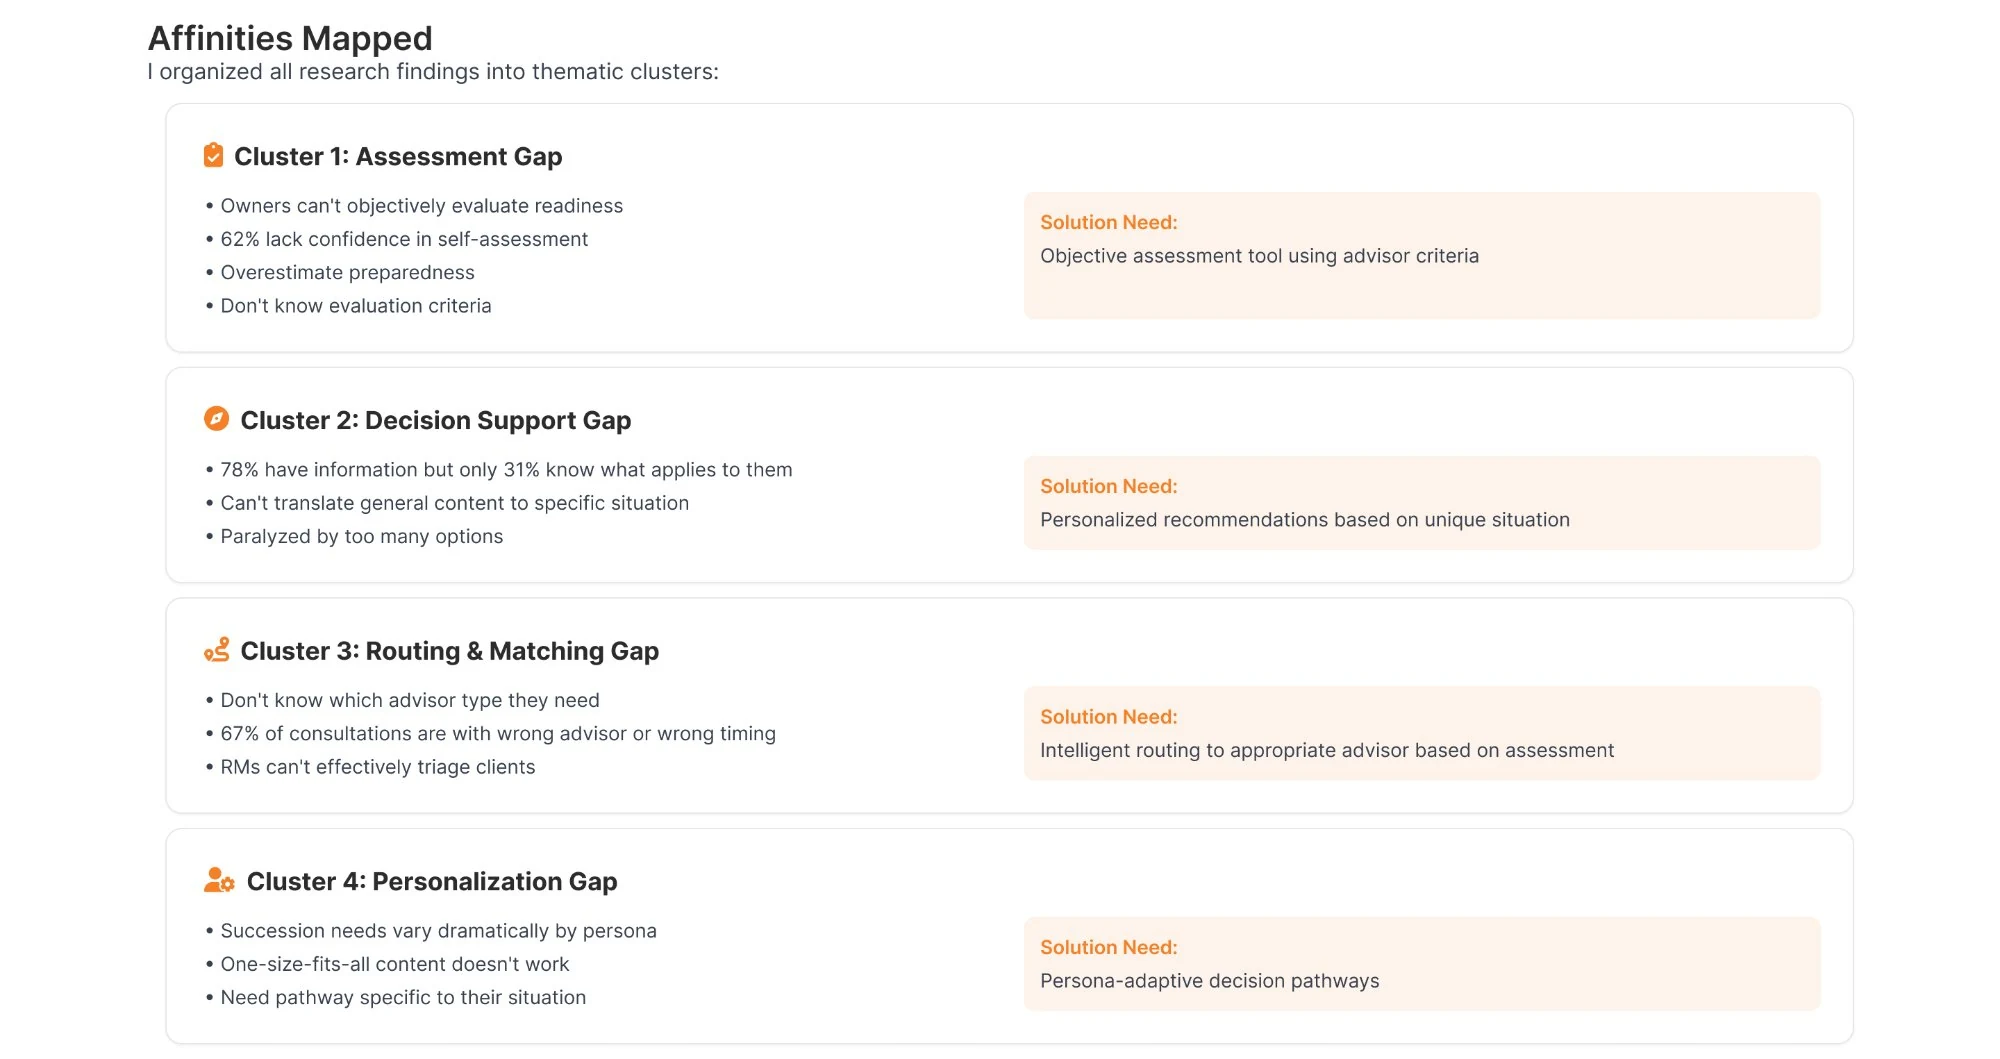
Affinities Mapped
I organized all research findings into thematic clusters — each revealing a specific gap that needed a specific solution type.
1
Assessment Gap
Owners can't objectively evaluate readiness
62% lack confidence in self-assessment
Overestimate preparedness
Don't know evaluation criteria
Solution Need
Objective assessment tool using advisor criteria
2
Decision Support Gap
78% have information but only 31% know what applies to them
Can't translate general content to specific situation
Paralyzed by too many options
Solution Need
Personalized recommendations based on unique situation
3
Routing & Matching Gap
Don't know which advisor type they need
67% of consultations are with wrong advisor or wrong timing
RMs can't effectively triage clients
Solution Need
Intelligent routing to appropriate advisor based on assessment
4
Personalization Gap
Succession needs vary dramatically by persona
One-size-fits-all content doesn't work
Need pathway specific to their situation
Solution Need
Persona-adaptive decision pathways
4 affinity clusters from research synthesis — each gap mapped to a specific solution need
03Chapter 03 of 06
Strategy & decisions
A portal would have improved the surface. Only a rule engine could change the system.
Before the pivot could be approved, leadership needed answers to four legitimate concerns about the algorithm-first approach. Each required a concrete counter-argument grounded in research.
Concern: Trust & Algorithm Acceptance
Will business owners trust an algorithm to assess something as personal as succession planning?
Strategy: Transparency Builds Trust
Show HOW scores are calculated. Research proves algorithmic transparency increases trust. Validate against 50–100 past clients. Target 90%+ agreement with advisor recommendations. Edge cases become learning opportunities.
Concern: Accuracy & Validation
How do we know the algorithm will be accurate?
Strategy: Historical Validation
Test against 50–100 past clients. Target 90%+ agreement with advisor recommendations. Every discrepancy becomes an algorithm refinement opportunity, not a failure.
Concern: Risk & Investment
What if we build this and it doesn't work? We've already spent 3 weeks on research.
Strategy: Solving Real Problems
78% already have enough information. A portal won't move the needle. The algorithm addresses actual barriers: assessment and decision support. Research de-risks the build significantly.
Concern: Complexity & ROI
This sounds more complex and expensive than a portal. Is it worth it?
Strategy: Strategic Differentiation
No competitor offers intelligent succession assessment. Positions PNC as innovation leader. Scales advisor efficiency 2x. The additional 8 weeks of build time generates $1.5M+ in annual revenue.
Decision: Approved — Build rule-based decision engine instead of portal
"This is the right call. Your research makes a compelling case that we were solving for the wrong problem. Let's build something that actually helps owners assess and decide, not just read. But we need to see proof that the algorithm works and that users will trust it." — VP of Business Banking
Phase 1 · Discovery Complete
Phase 2 · Solution Architecture
03.2Design Direction
Three Directions. One Right Answer.
Before committing to the rule-based engine, I mapped three credible product directions against the research findings. The goal was to make the direction choice explicit and defensible — not to arrive at the "right" answer by default.
Direction 01 · Discarded
Enhanced Content Portal
The original brief. Better-organized articles, videos, and guides with improved navigation. Fast to build, low risk, familiar to stakeholders.
✕ Fails the root cause — owners have enough information. More content doesn't solve assessment or routing gaps.
Direction 02 · Discarded
Guided Questionnaire
A simple step-by-step form that collects owner information and routes them to relevant content sections. Lower complexity than a rule engine.
✕ Surface-level personalization — no scoring, no gap analysis, no advisor matching. Doesn't make advisor logic visible.
Direction 03 · Selected
Rule-Based Assessment Engine
47 codified business rules. Two-dimensional readiness scoring. Persona routing. Personalized action plans. Advisor matching.
✓ Addresses all four research gaps — assessment, decision support, routing, and personalization.
Why Direction 03 won
Research showed the real problem was codified decision-making expertise locked in advisors' heads. Only a rule-based engine could make that expertise accessible, scalable, and personalized without requiring an advisor in every interaction. Directions 01 and 02 would have improved the surface — not the system.
03.3How I changed minds
Four groups. Four different arguments.
The pivot held because each group was moved by its own kind of evidence: research for leadership, their own logic played back for advisors, test data for engineering, and a working tool for relationship managers.
Bank leadershipBusiness Banking
Started at
Owners don't engage because they lack education. Build the portal.
What moved them
Three weeks of discovery, then a direct answer to each of four concerns: trust, accuracy, risk and ROI. 78% already had enough information; only 31% knew which option fit.
Outcome
Approved: build the decision engine instead of the portal, with proof that the algorithm works and that owners trust it.
Succession advisors8 specialists
Started at
Their assessment was intuitive, held in their heads, 20 to 30 factors at a time.
What moved them
I played back the IF/THEN logic observed in shadowed consultations: "Is this what you're actually doing?" Dot voting and paired comparisons replaced debate.
Outcome
63 factors became 47 rules with agreed weights. "For 95%+ of situations, this will route owners correctly."
Engineering leadBuild team
Started at
Calculate scores only after all 47 questions. Simpler architecture, faster build.
What moved them
Testing data: a visible progress bar cut mid-assessment abandonment by 68%. The tradeoff, quantified.
Outcome
1.5 extra weeks agreed for live scoring. 85% completion rate.
Relationship managersRound 3, n=8
Started at
No concrete offer for clients, and guessing which advisor to recommend. Net engagement 8%.
What moved them
Using the assessment with clients in usability testing, with advisor matching doing the routing.
Outcome
9.1/10 confidence and net engagement from 8% to 25%. "Take this 20-minute assessment."
03.4Product Ownership
Key Design Tradeoff
Decision: Real-Time Scoring, Not Post-Completion
The Technical Constraint: Engineering proposed calculating scores only after all 47 questions completed. Simpler architecture, faster build.
My Insistence: Users needed progress feedback during the 20-minute assessment to prevent abandonment. I specified live score calculation with visible progress bar.
How I got alignment: I brought testing data showing 68% reduction in mid-assessment abandonment with a visible progress bar. Engineering agreed once the tradeoff was quantified — 1.5 extra weeks for a measurable retention gain.
85% completion rate with live scoring
// Rule 1.1 · Urgent Exit Pathway TriggerIF (timeline < 12 months) AND (successor_identified = false)
AND (management_team_tenure < 24 months)
THEN RECOMMEND: Urgent Exit Pathway → Strategic Sale
MATCH: Crisis succession advisor
// Rule 1.2 · High Customer Concentration RiskIF (top_customer_revenue_pct > 40%)
THEN FLAG: HIGH_CONCENTRATION_RISK
IMPACT: Reduce attractiveness score by 15 points
// Rule 1.3 · Owner Dependency FlagIF (owner_daily_involvement = "handles most decisions")
THEN IMPACT: Reduce readiness score by 20 points
// Rule 1.4 · Family Succession Successor Experience GateIF (succession_type = "family") AND (successor_experience < 36 months)
THEN TIMELINE: "Minimum 2–3 years preparation before transfer"
04Chapter 04 of 06
The engine
The checklist in advisors' heads, codified into 47 rules owners could run for themselves.
Codifying Advisor Expertise Into Algorithmic Rules
I shifted into solution architecture mode to translate human expertise into intelligent design. Three major challenges: codify advisor judgment into algorithmic rules, develop a model that assesses both business and personal readiness, and architect a dynamic context-aware question flow that reduces cognitive load while delivering personalized guidance.
Step 1 — Codified Advisor Expertise Into Algorithmic Rules
I conducted structured workshops with eight advisors to extract their tacit expertise and formalize it into a rule-based assessment framework.
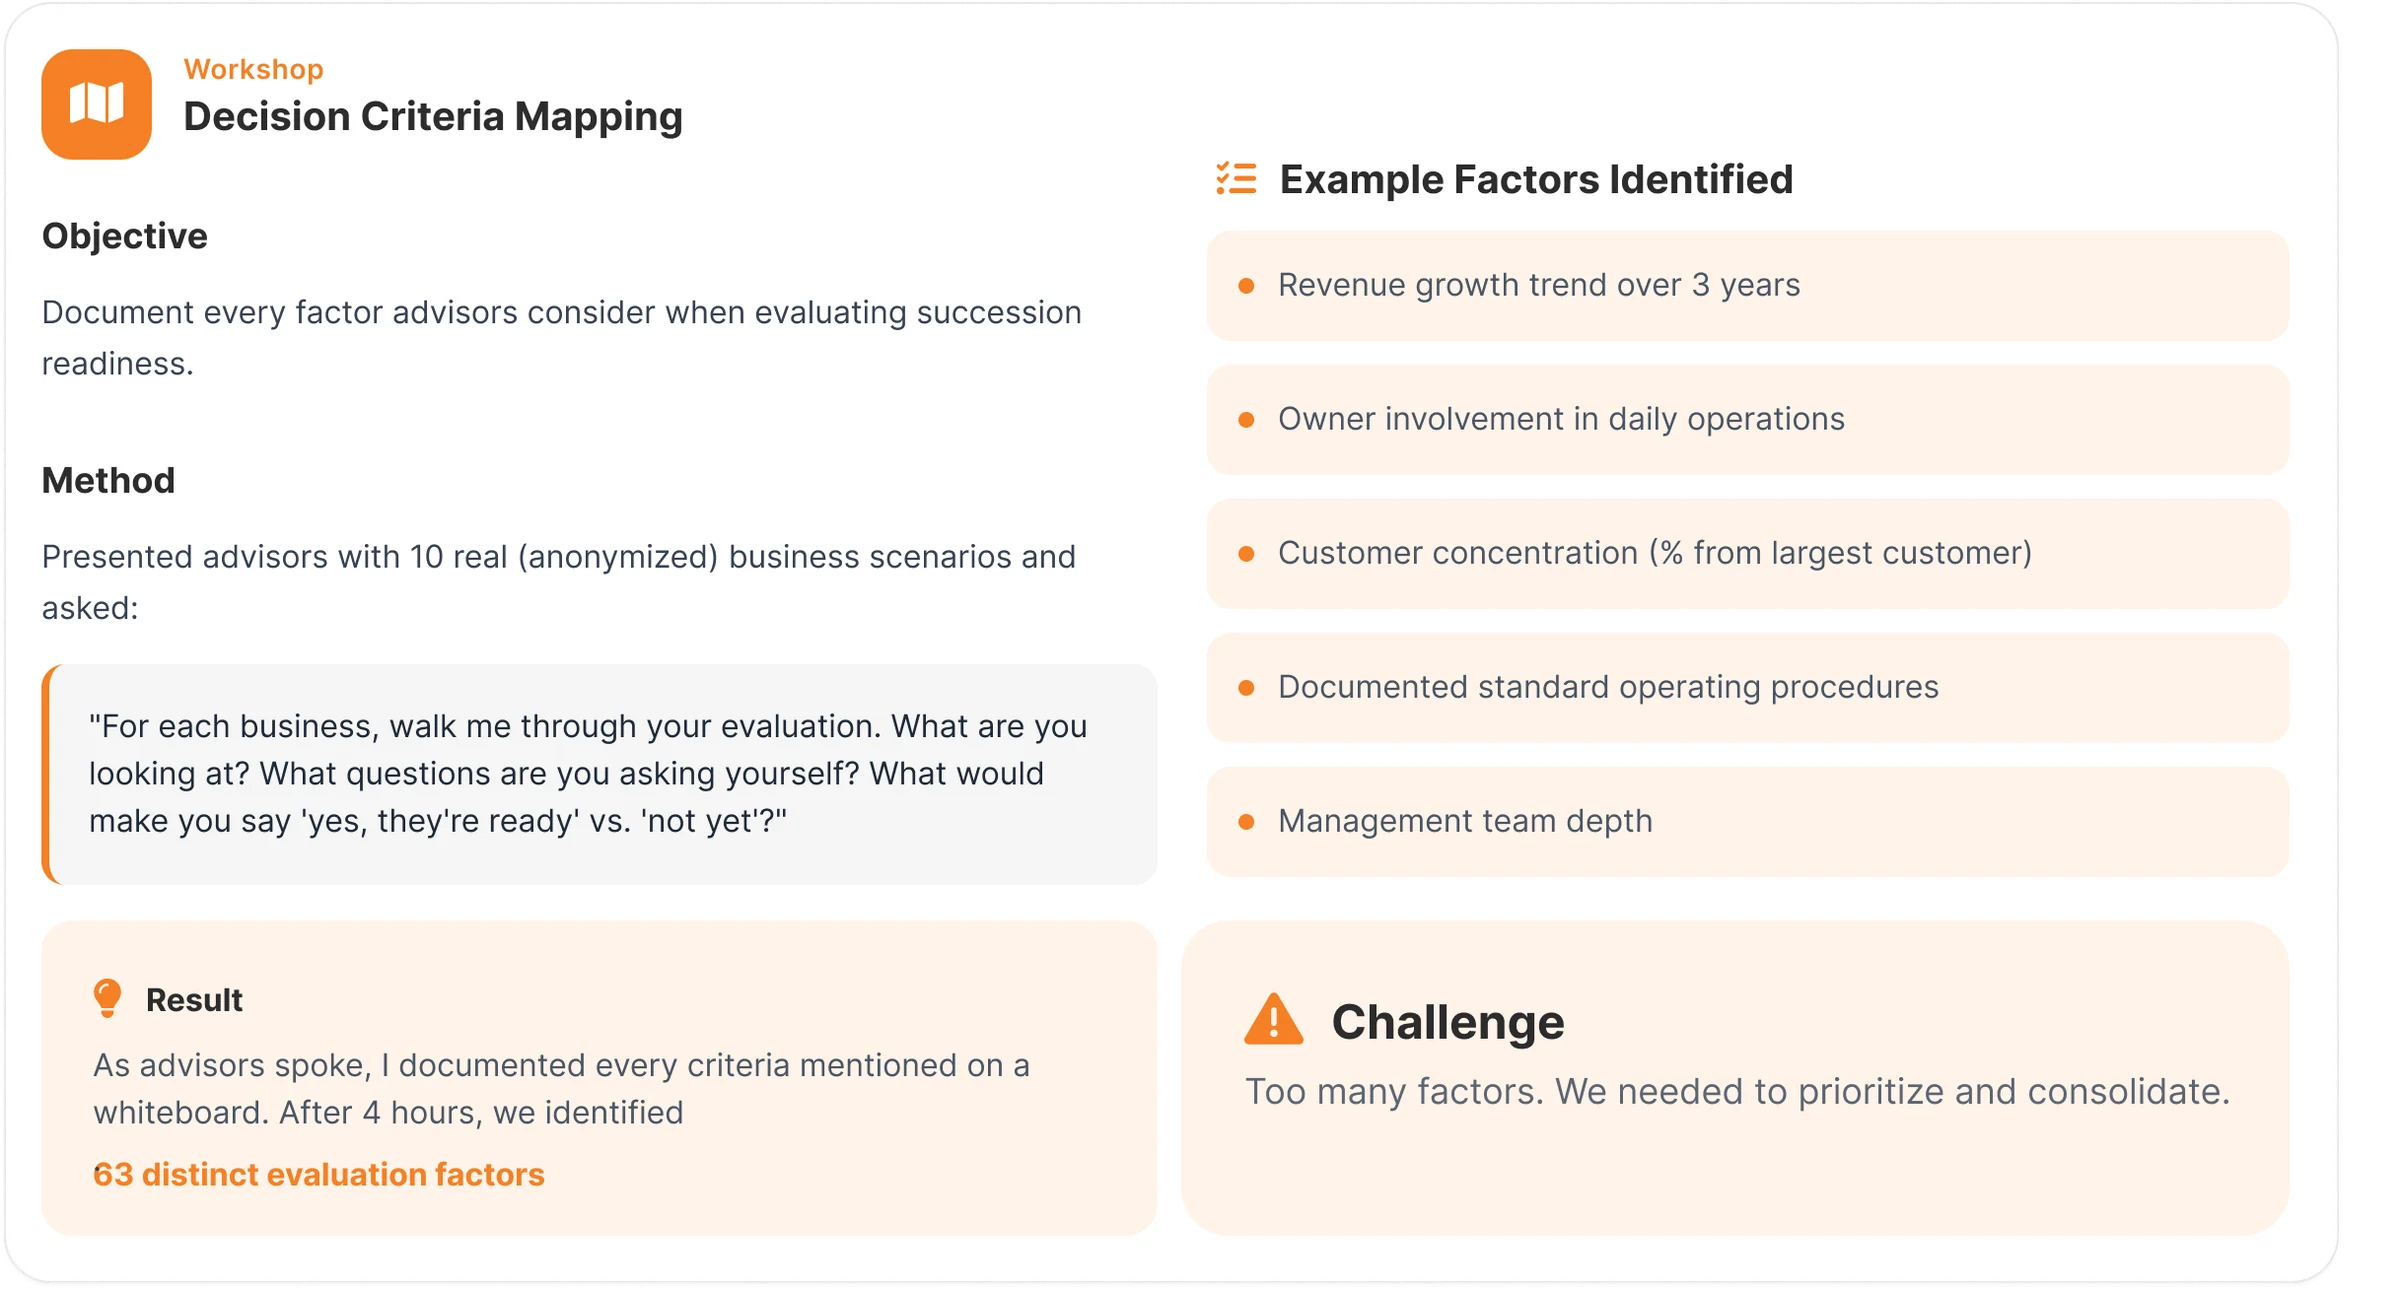
1
Workshop 01
Decision Criteria Mapping
Objective: Document every factor advisors consider when evaluating succession readiness. For each dimension, I asked advisors to walk through real business scenarios while I documented every criterion mentioned on a whiteboard.
Method: As advisors spoke, I documented every criterion mentioned. After 4 hours, we identified 63 distinct evaluation factors. Challenge: Too many factors — needed to prioritize and consolidate.
→ 63 distinct factors identified
2
Workshop 02
Prioritization & Consolidation
Objective: Narrow to most critical factors and organize into categories. Used dot voting exercise — 20 dots per advisor on most critical factors. This surfaced what advisors actually weight when forming recommendations vs. what they mention in passing.
Method: Dot voting exercise with all 8 advisors simultaneously. Forces prioritization without group-think anchoring from verbal discussion.
→ 4 dimensional categories · 12–22 factors each
3
Workshop 03
Weighting & Scoring
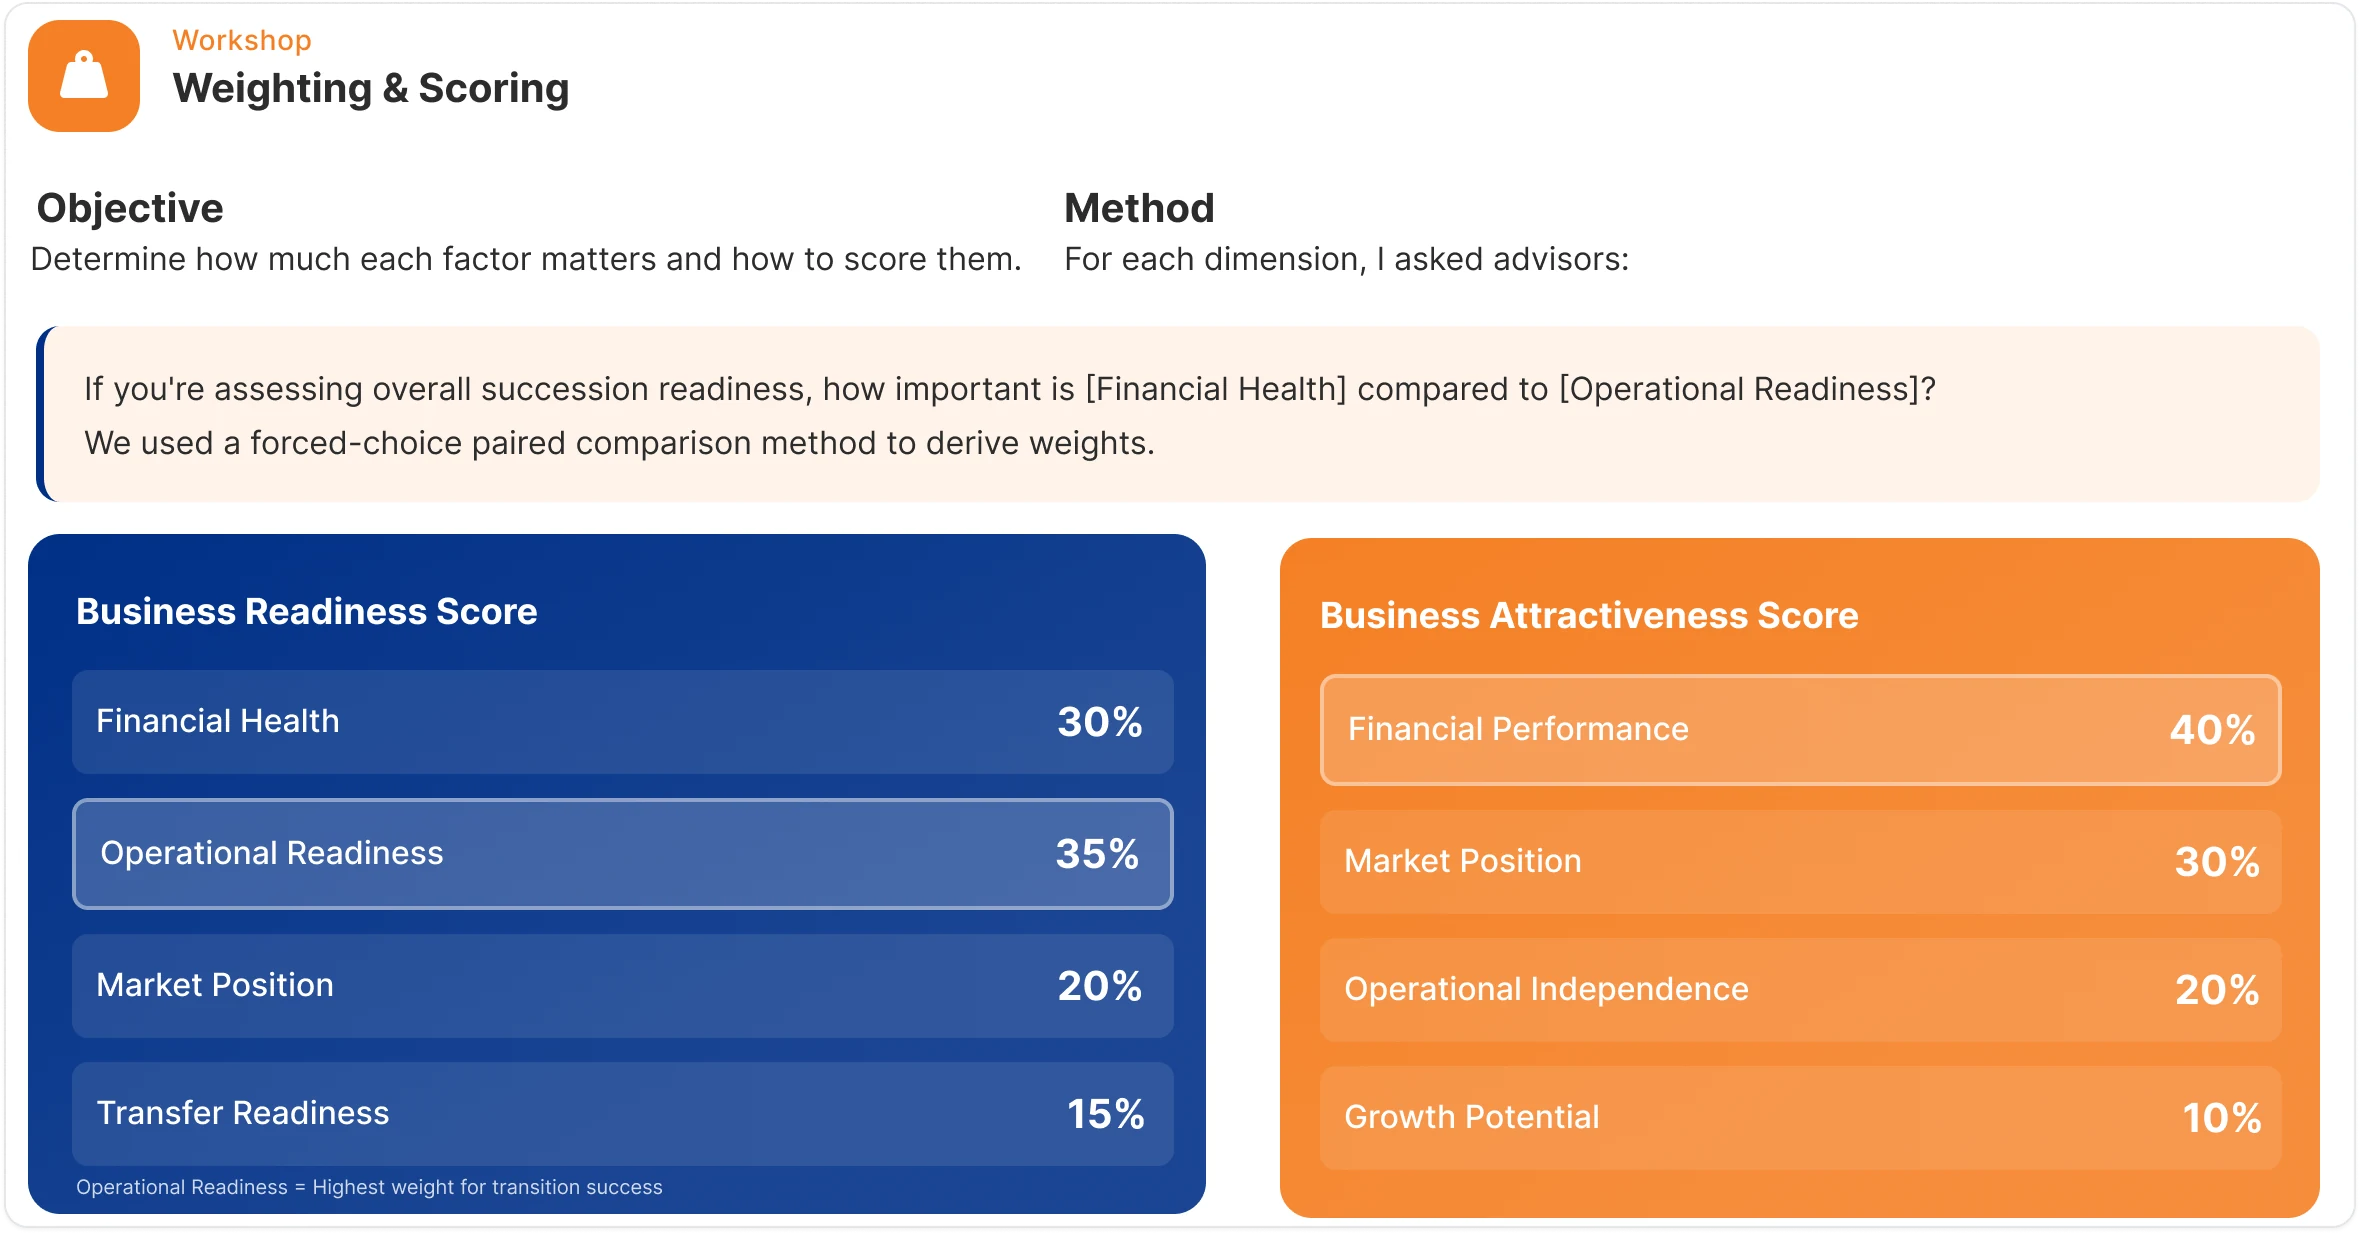
Objective: Determine how much each factor matters and how to score them. Presented advisors with 10 real (anonymized) business scenarios. "For each business, walk me through your evaluation. What are you looking at? What would make you say 'yes, they're ready' vs. 'not yet'?"
Method: Forced-choice paired comparison method to derive weights. "If you're assessing overall succession readiness, how important is Financial Health compared to Operational Readiness?"
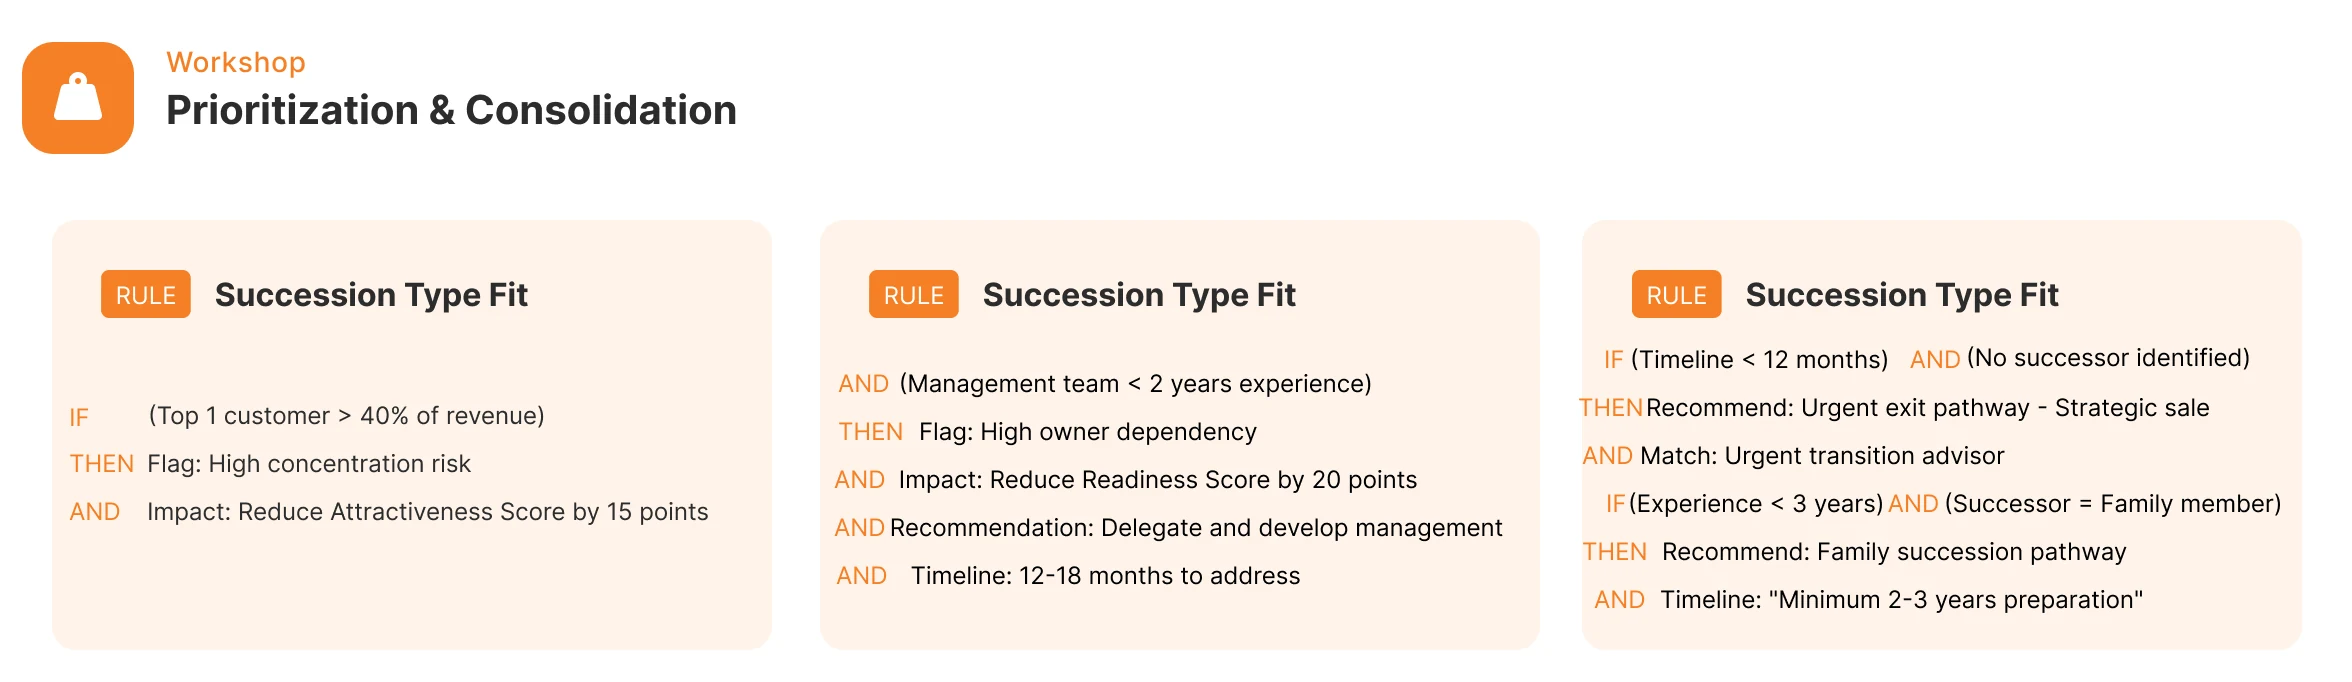
Objective: Translate verbal IF/THEN advisor logic into formal, testable business rules. Each rule specifies: conditions, resulting flags, recommended advisor match criteria, and estimated timeline impact on the owner's plan.
Method: I presented the IF/THEN structures I'd observed in shadowing sessions back to advisors for validation. "Is this what you're actually doing?" They confirmed, refined, and extended.
→ 47 finalized rules total · 12 of which are persona identification rules · 5 advisor matching algorithms
47
Codified Business Rules (total)
8
Dimension Weights & Scoring Sets
15+
Threshold Decision Logics
5
Advisor Matching Algorithms
13
Persona ID Rules (within the 47)
Sample Codified Rules — Translated From Advisor Expertise
// Rule 1.1 — Urgent Exit Pathway TriggerIF (timeline < 12 months)
AND (successor_identified = false)
AND (management_team_tenure < 24 months)
THENRECOMMEND: Urgent Exit Pathway → Strategic Sale
MATCH: Crisis succession advisor
FLAG: "No successor identified in compressed timeline"
// Rule 1.2 — High Customer Concentration RiskIF (top_customer_revenue_pct > 40%)
THENFLAG: HIGH_CONCENTRATION_RISK
IMPACT: Reduce attractiveness score by 15 pointsRECOMMEND: "Diversify customer base before approaching buyers — 12–18 months of work minimum"
// Rule 1.3 — Owner Dependency FlagIF (owner_daily_involvement = "handles most decisions")
THENFLAG: HIGH_OWNER_DEPENDENCY
IMPACT: Reduce readiness score by 20 pointsRECOMMEND: "Delegate and develop management team"
TIMELINE: "12–18 months to address"
// Rule 1.4 — Family Succession Successor Experience GateIF (succession_type = "family")
AND (successor_experience < 36 months)
THENRECOMMEND: Family Succession Pathway — Extended prep track
TIMELINE: "Minimum 2–3 years preparation before transfer"
MATCH: Family Business Succession Specialist
Step 2 — Designing the Assessment Model
Succession readiness is multi-dimensional. It's not one score — it's evaluation across at least 4 major categories with 10–15 factors each. Two dimensions matter because readiness and attractiveness define when and how a business should transition — ensuring owners don't exit too early, undervalue their company, or miss the opportunity to maximize outcomes.
Financial Health
30%
Revenue trend (3-year)
Profitability margins vs. benchmarks
Cash flow consistency
Debt-to-equity ratio
Working capital adequacy
Customer concentration risk
Revenue diversification
Compliance status
Operational Readiness
35%
Owner involvement in daily ops
Management team strength
Documented processes (SOPs)
Key person dependencies
Employee retention rates
Technology systems maturity
Supplier relationships
Market Position
20%
Competitive advantages
Market share position
Customer loyalty rates
Brand recognition
Industry attractiveness
Growth potential
Barriers to entry
Transfer Readiness
15%
Owner emotional readiness
Successor identification
Financial readiness for retirement
Timeline clarity and urgency
Succession goals clarity
Estate planning status
Legal structure
Why Operational Readiness is weighted highest (35%): It is the most common failure point in succession transitions and the dimension where advisor intervention creates the most value. A business built around a single owner's knowledge and relationships cannot transfer cleanly without operational independence — this is why 67% of initial consultations result in "not ready yet."
All four personas: characteristics, critical needs, and why each decision path differs. The model’s output was based on these: they decided which route an owner’s assessment took.
04.2Assessment Model
Two-Dimensional Readiness Scoring
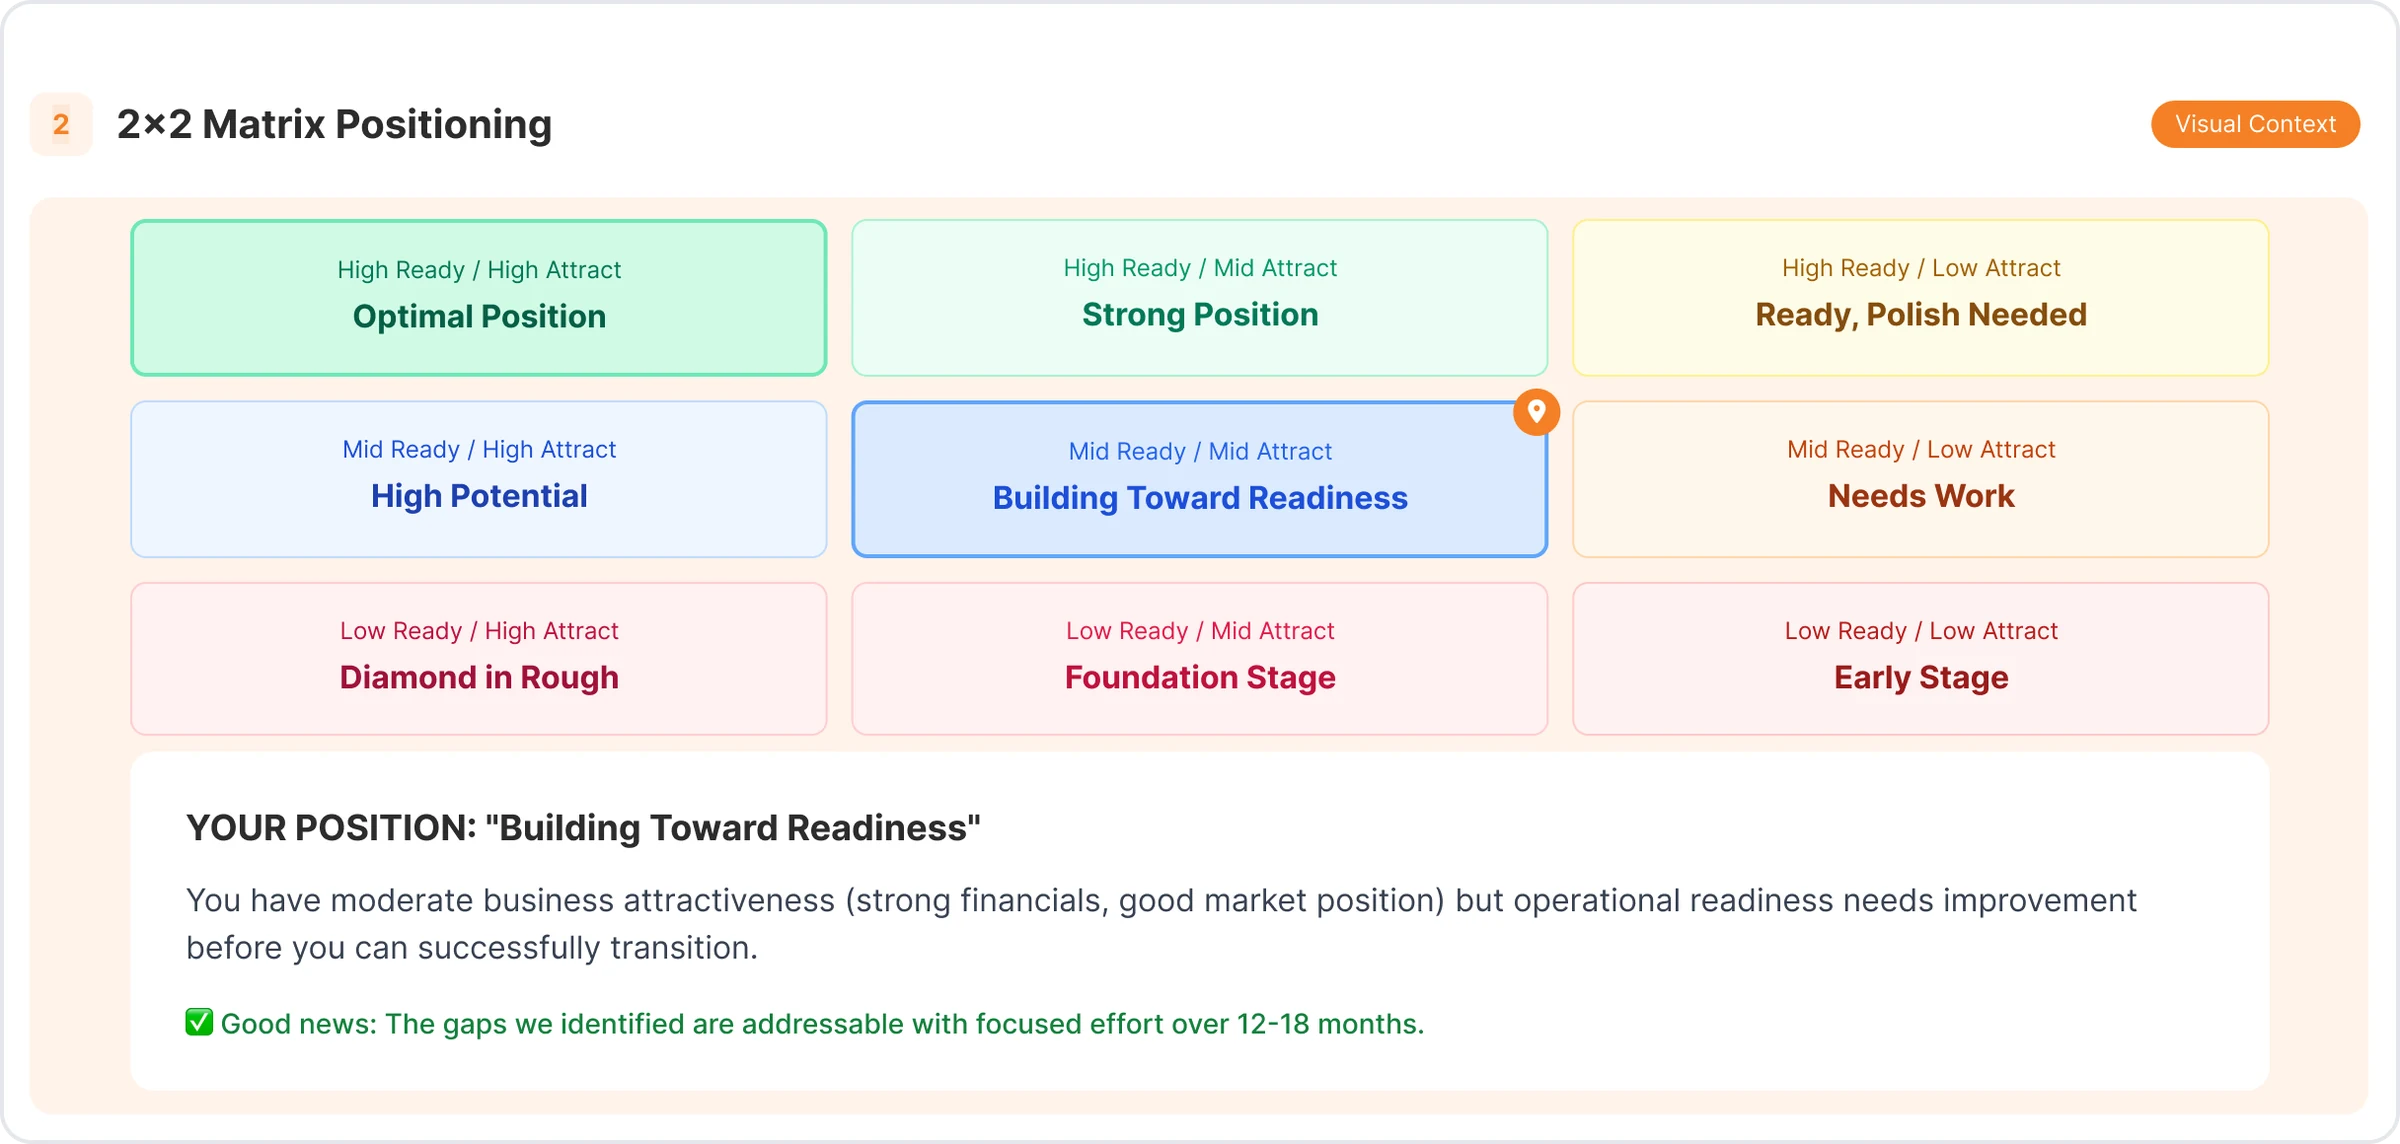
The algorithm calculates weighted scores across 4 dimensions, generating a Business Readiness Score (0–100) and a Business Attractiveness Score (0–100). These map to a 2×2 matrix creating 9 positioning zones — each triggering personalized messaging, next steps, advisor matching, content recommendations, and timeline estimates.
Business Readiness Score (0–100)
"Is this business operationally ready for ownership transition?"
0–40: Not Ready — Major gaps, 18–24+ months needed
41–70: Preparing — Some gaps, 9–18 months needed
71–100: Ready Now — Minor gaps, can proceed
Business Attractiveness Score (0–100)
"How appealing to potential successors or buyers?"
0–40: Limited Appeal — Significant value concerns
41–70: Moderate Appeal — Average market positioning
2×2 Matrix — 9 positioning zones, each triggering unique messaging, next steps, advisor matching, and timeline estimates
Business Attractiveness → Low | Mid | High
Business Readiness → High | Mid | Low
B
Ready, Work on Value
A
Strong Position
A+
Optimal Position
C
Not Yet
B
Building
A−
Nearly There
D
Early Stage
C
Foundation Phase
C+
Hidden Potential
9 Zones. Personalized Guidance at Every Position.
Each zone triggers unique messaging tone, next steps, advisor matching criteria, content recommendations, and timeline estimates. No two owners receive the same guidance.
A+
Optimal Position — High Ready / High Attract
Minor gaps only. Multiple pathways viable. Move to advisor consultation immediately.
B
Building Toward Readiness — Mid Ready / High Attract
Strong attractiveness but operational gaps. 9–18 months of focused improvement with clear priorities.
A
Strong Position — High Ready / Mid Attract
Ready operationally — work on increasing market attractiveness before approaching buyers.
D
Early Stage — Low Ready / Low Attract
18–24+ months needed. Foundation phase — prioritized gap closure plan generated across all 4 dimensions.
Design Rationale
Used round numbers (58, not 58.3) to avoid false precision. Show both dimensions side-by-side with neutral color palette. Use descriptive labels, not just numbers — "You're in the Building Toward Readiness zone" communicates more than "58/72".
The challenge was to interpret the same business data differently based on context. The same operational, financial, or leadership scores can mean very different things for different types of owners. The solution was a persona identification algorithm — a logic layer that classifies each owner early in the conversation so recommendations, priorities, and advisor matches are tailored to their unique succession path.
Early in the assessment, the system determines persona through strategic triage questions:
TRIAGE Q1
What's prompting you to think about succession planning right now?
Health / unexpected→ Signal: Urgent Exit
Planning retirement→ Signal: Strategic Seller
Pass to family→ Confirms: Family Succession
Reward employees→ Signal: ESOP
TRIAGE Q2
What's your timeline for transitioning out of the business?
< 12 months→ Confirms: Urgent Exit
1–3 years→ Suggests: Strategic Seller
3–5 years→ Confirms: Strategic/ESOP
5+ years / not sure→ Run full assessment
TRIAGE Q3
What type of succession are you considering?
Sell to outside buyer→ Confirms: Strategic Seller
Transfer to family→ Confirms: Family Succession
Sell to employees→ Confirms: ESOP
Not sure / exploring→ Run full assessment
After 5–8 triage questions: Persona is identified with confidence score, then the same assessment data gets interpreted differently based on persona match. When confidence falls below threshold — typically when answers are ambiguous or contradictory — the system routes to the full 47-question assessment rather than the adaptive short path.
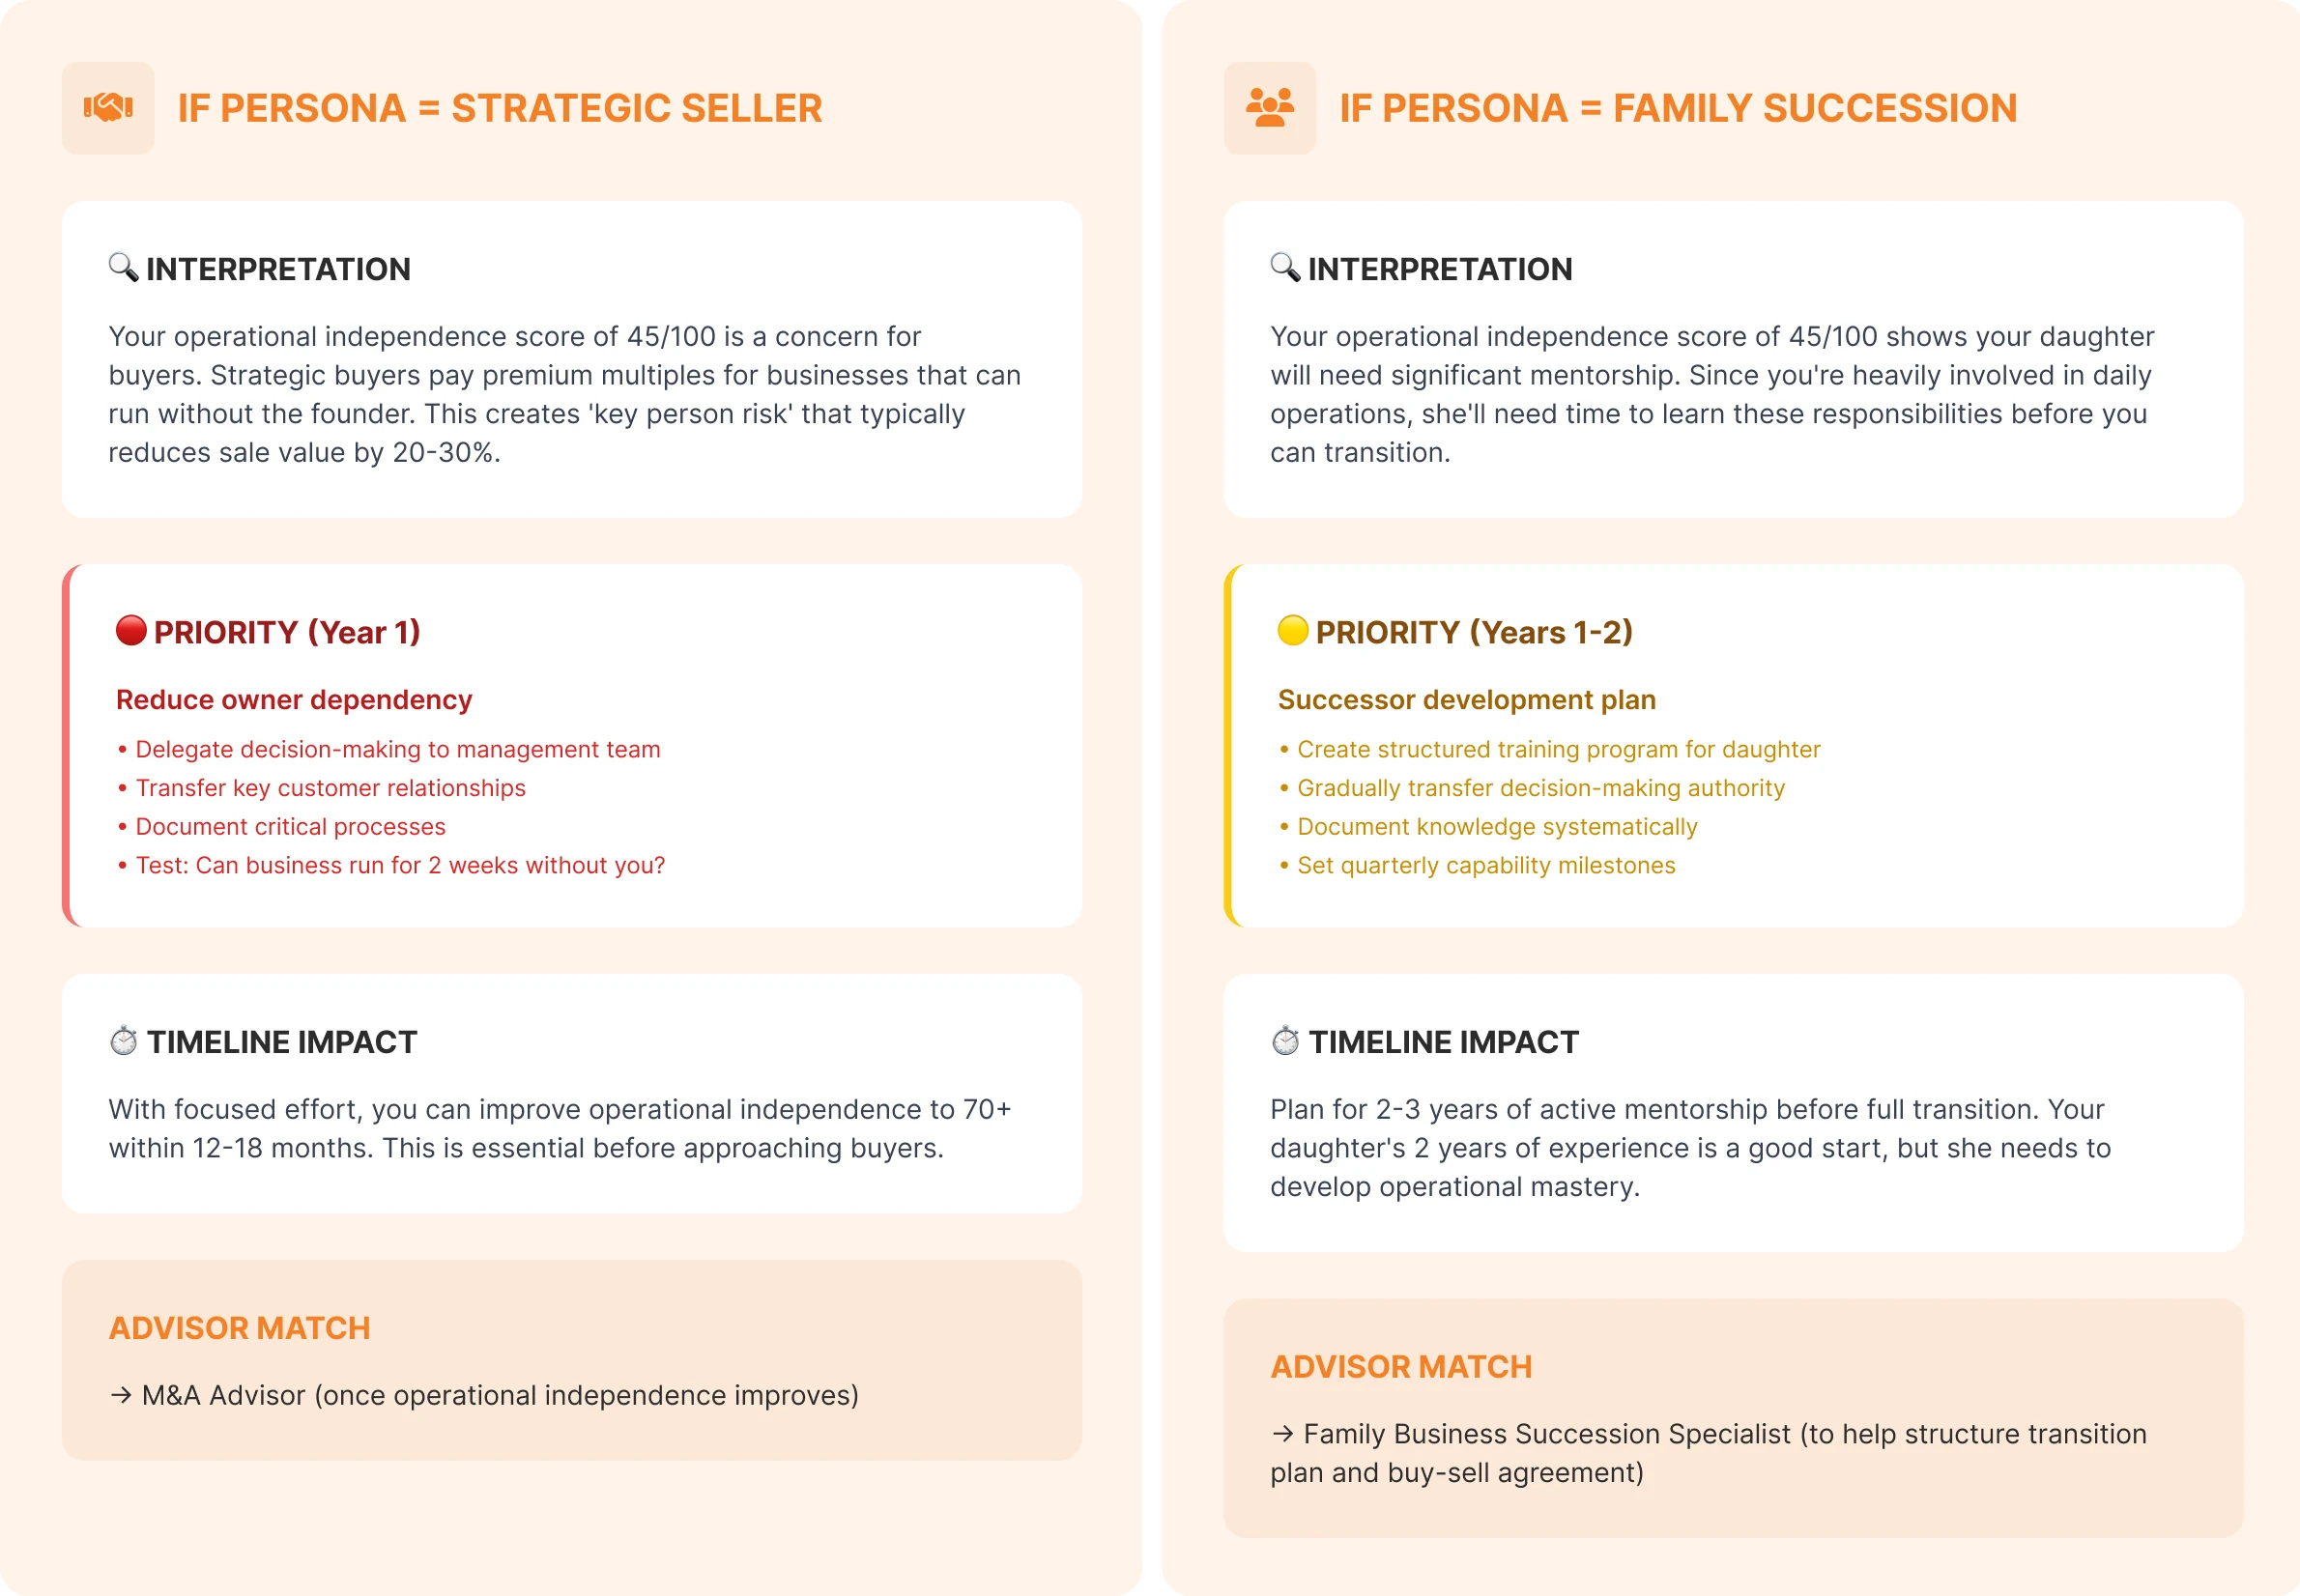
Persona Differentiation in Action — Same Data, Completely Different Interpretation
Scenario: Owner with 45/100 Operational Independence · Strong financials · Daughter as successor · 3–4 year timeline
Critical Insight
Same assessment data (Operational Independence 45/100), completely different interpretation and recommendations based on persona. The algorithm adapts its priorities and advice to match the owner's specific succession goals — this is what makes it a decision engine, not an information portal.
04.4Assessment Question Flow
Step 4 — Assessment Question Flow Design
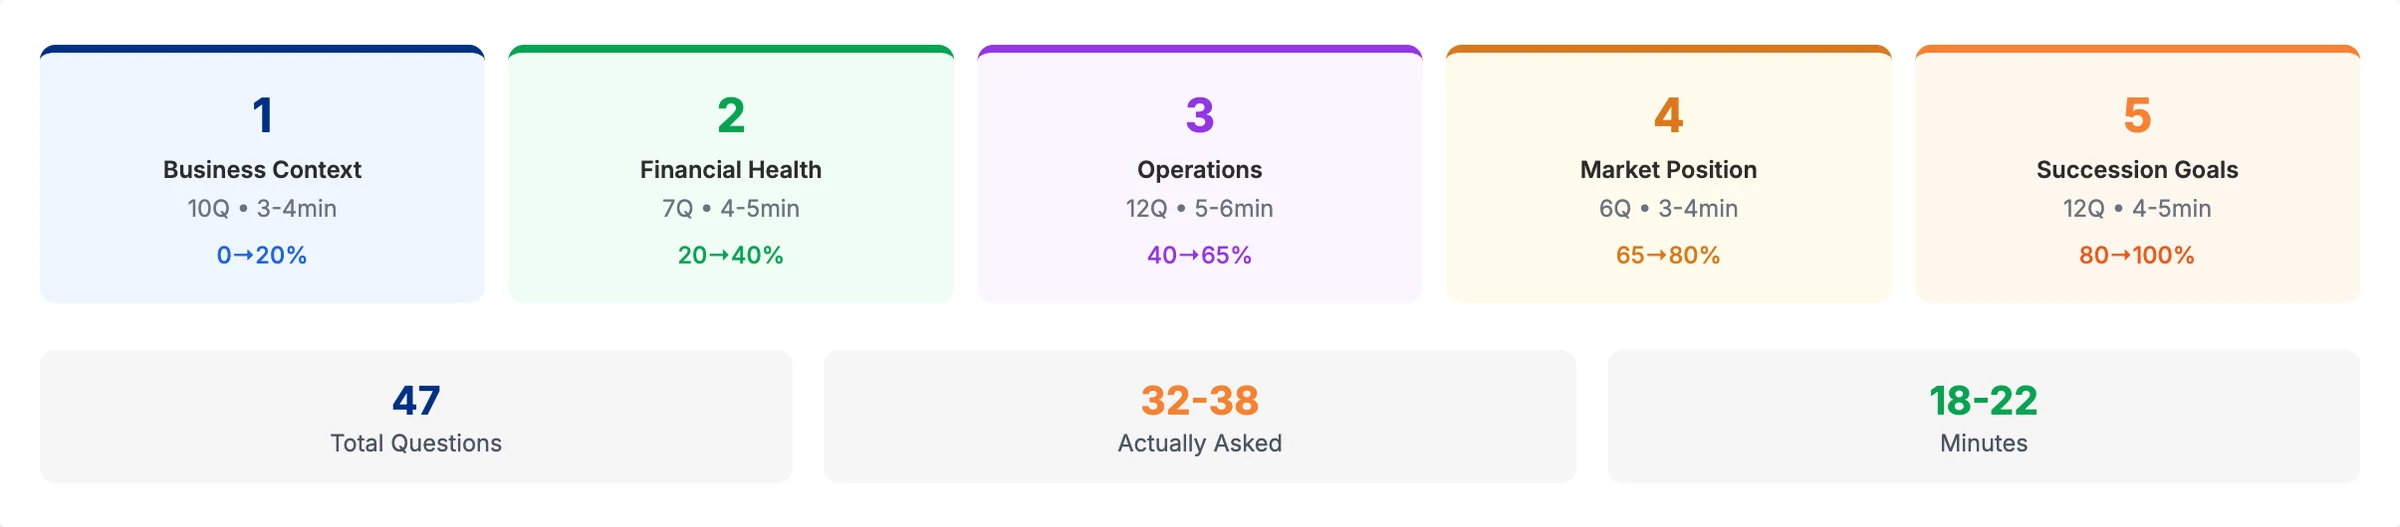
The challenge: Don't show all 47 factors at once. Users would abandon a tax-form-like experience. The solution: progressive disclosure with adaptive branching — group into digestible phases, skip irrelevant questions, sequence easy-to-hard.
Progressive Disclosure
5 phases, ~47 questions total, but only 32–38 actually asked per user. Questions are grouped into phases with natural topic progression — Financial → Operational → Market → Goals.
Adaptive Branching
Skip irrelevant questions based on responses. Single owner → skip partnership questions. No employees → skip management questions. Not family succession → skip family dynamics entirely.
Easy to Hard Sequencing
Build momentum with simple factual questions first (What industry? Years in business? Employee count?) then move to evaluative questions that require reflection. Reduces early abandonment.
5 Phases · ~47 Total Questions · 32–38 Asked Per User
Sample Question Flow
Q8 · Customer Concentration
FINANCIAL HEALTH · Question 8 of 10
What percentage of revenue comes from your single largest customer?
Less than 10%
10–20%
20–40%
40–60%
Over 60%
Why this matters: Buyers see high customer concentration as risk. Businesses with diversified revenue typically sell for 15–25% higher multiples.
Q10 · Operational Involvement
OPERATIONS · Question 10 of 12
How involved are you in day-to-day operations?
I handle most daily decisions and operations → Triggers additional management questions
I'm involved but have good managers
Mostly focused on strategy, team handles ops
Business runs independently
47
Total factors assessed
32–38
Questions asked per user (adaptive)
85%
Completion rate
4.2
User rating out of 5
Target completion time: 18–22 minutes. This was calibrated carefully — long enough to feel substantive and earn trust, short enough that busy business owners would commit. Testing showed 85% completion at 22-minute average, validating the sequencing design.
05Chapter 05 of 06
The product
135+ screens across 4 persona pathways, 9 scoring zones and 3 user types.
The core design challenge was making a 47-question algorithmic assessment feel valuable rather than burdensome — while presenting complex, multi-dimensional results that non-analytical business owners could understand and act on. Every screen was designed around a specific cognitive goal.
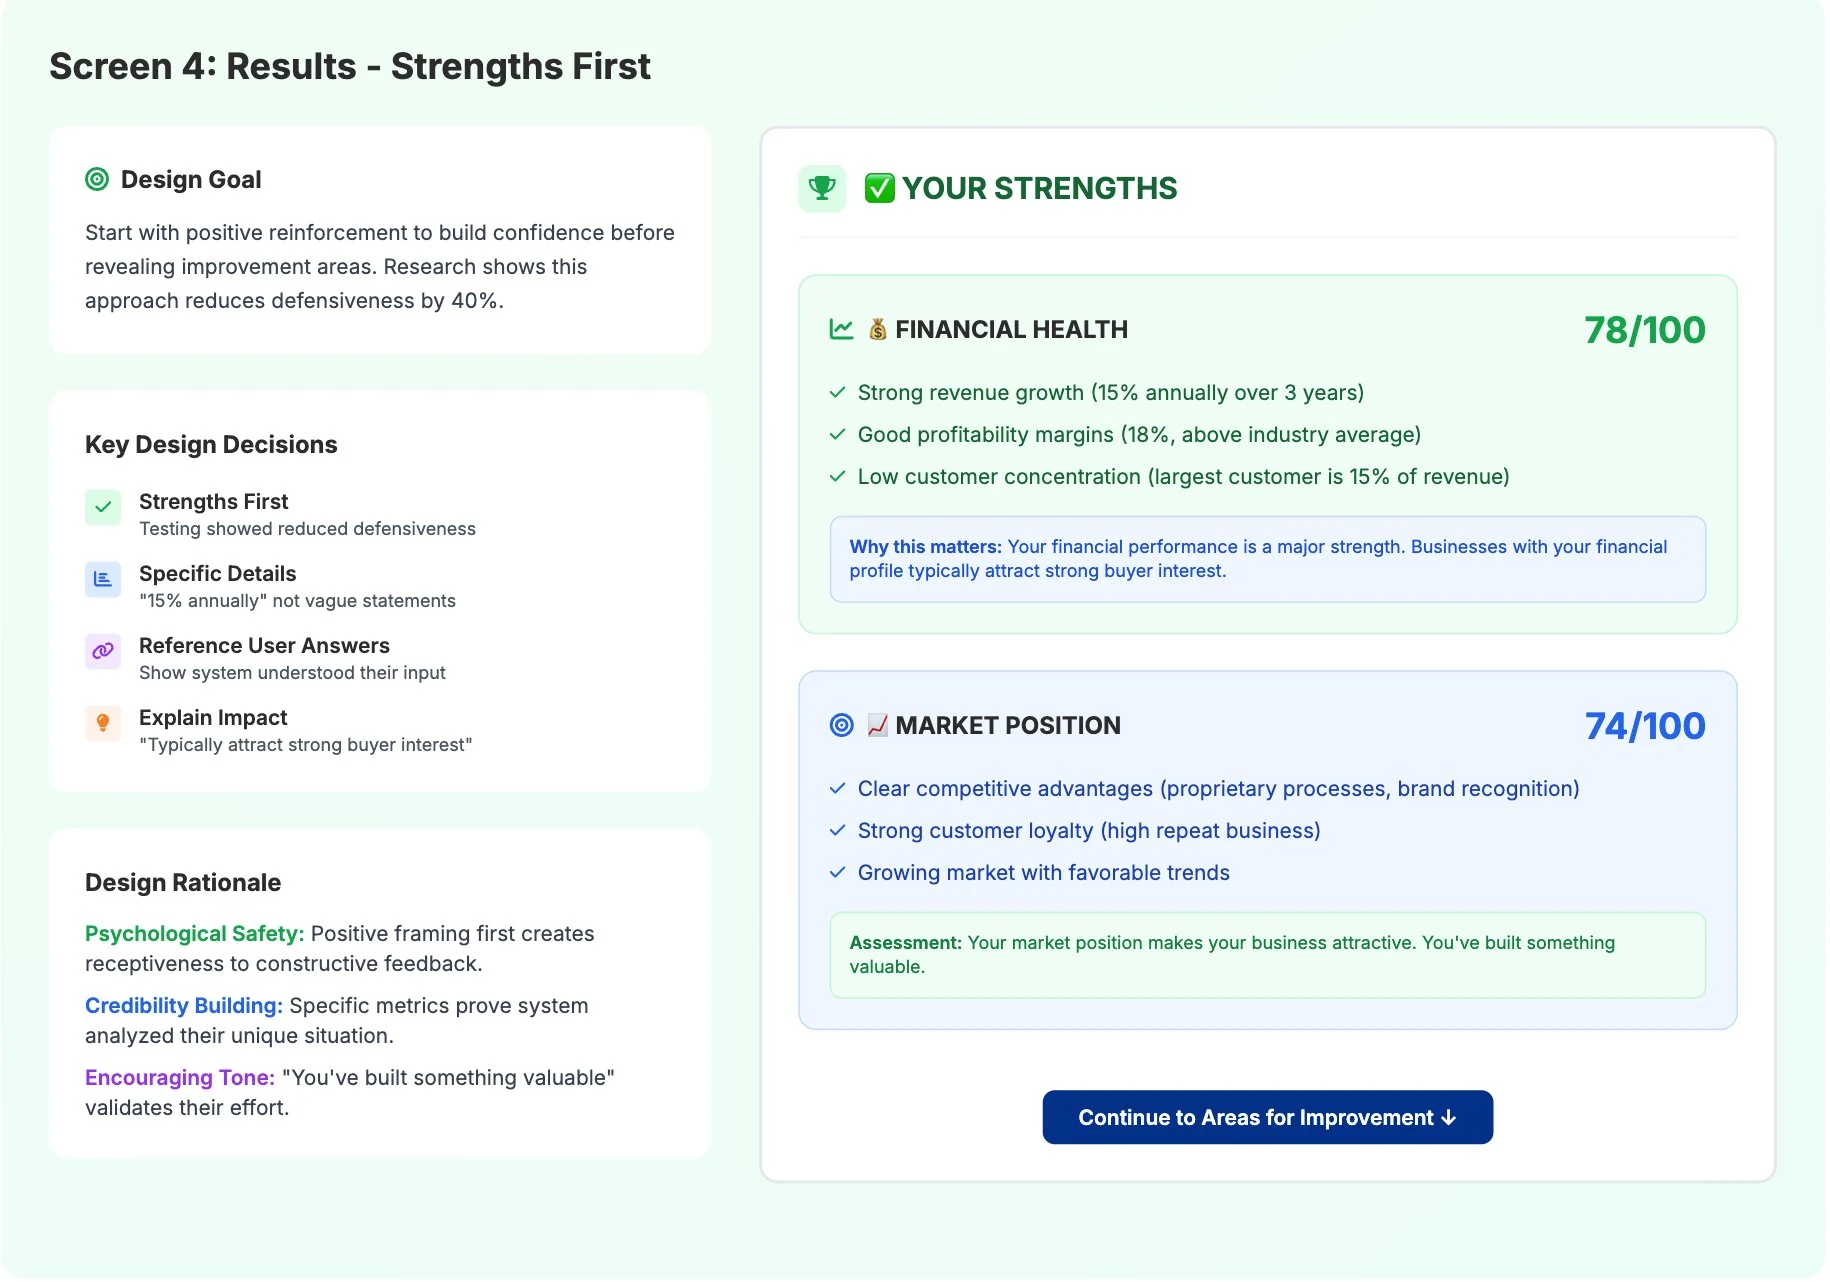
Depiction of Final Work
Branding revised due to intellectual property considerations · 135+ production screens
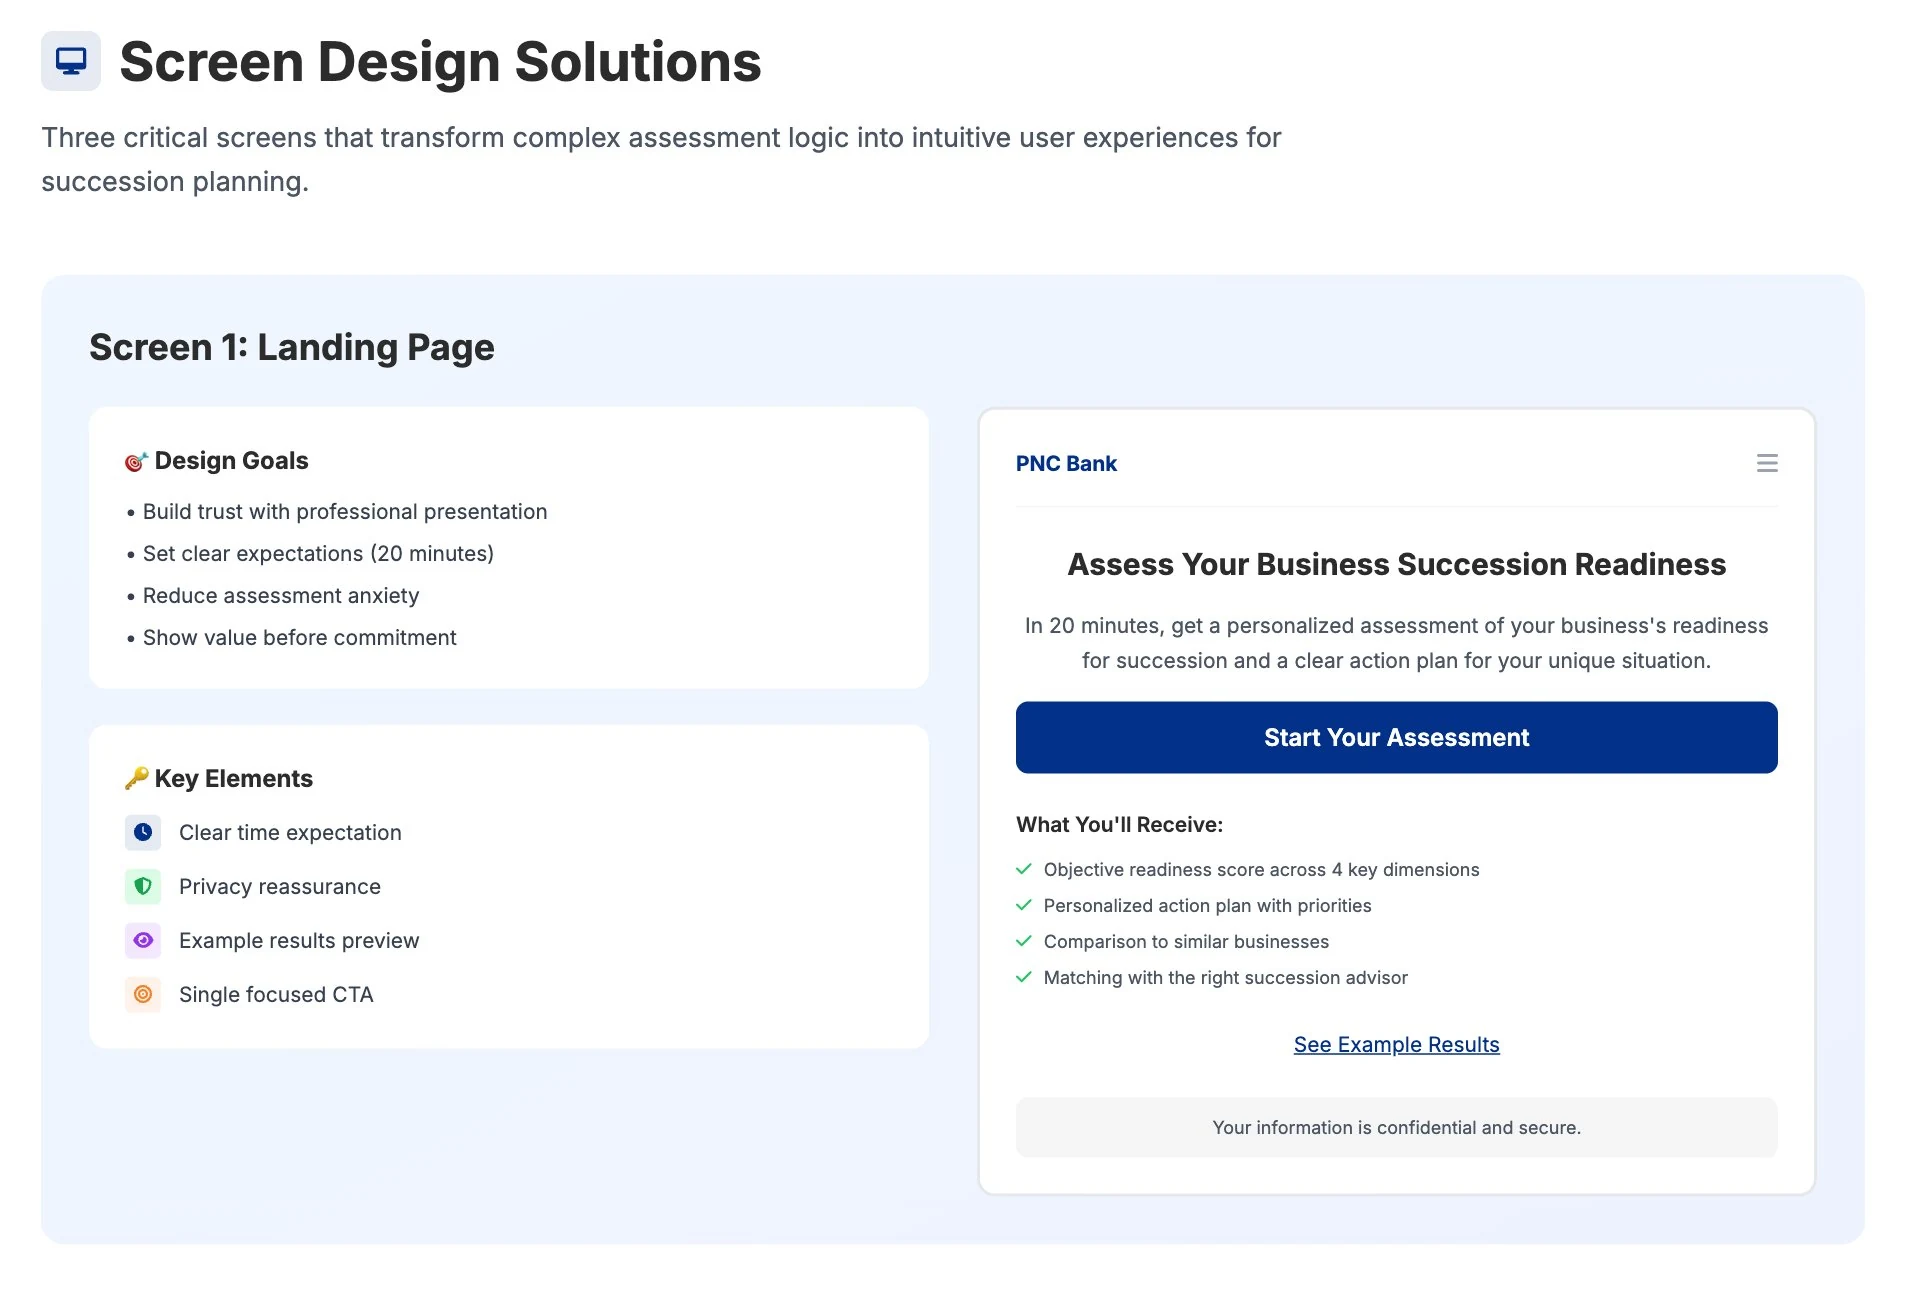
Screen 1
Landing Page
Design challenge: Build trust before asking for 20 minutes of a busy business owner's time. Show value before demanding commitment.
KEY DESIGN DECISION Show the output before asking for input. Time expectation upfront, example results preview, single focused CTA — no decision paralysis before commitment.
pnc.com/succession/assessment
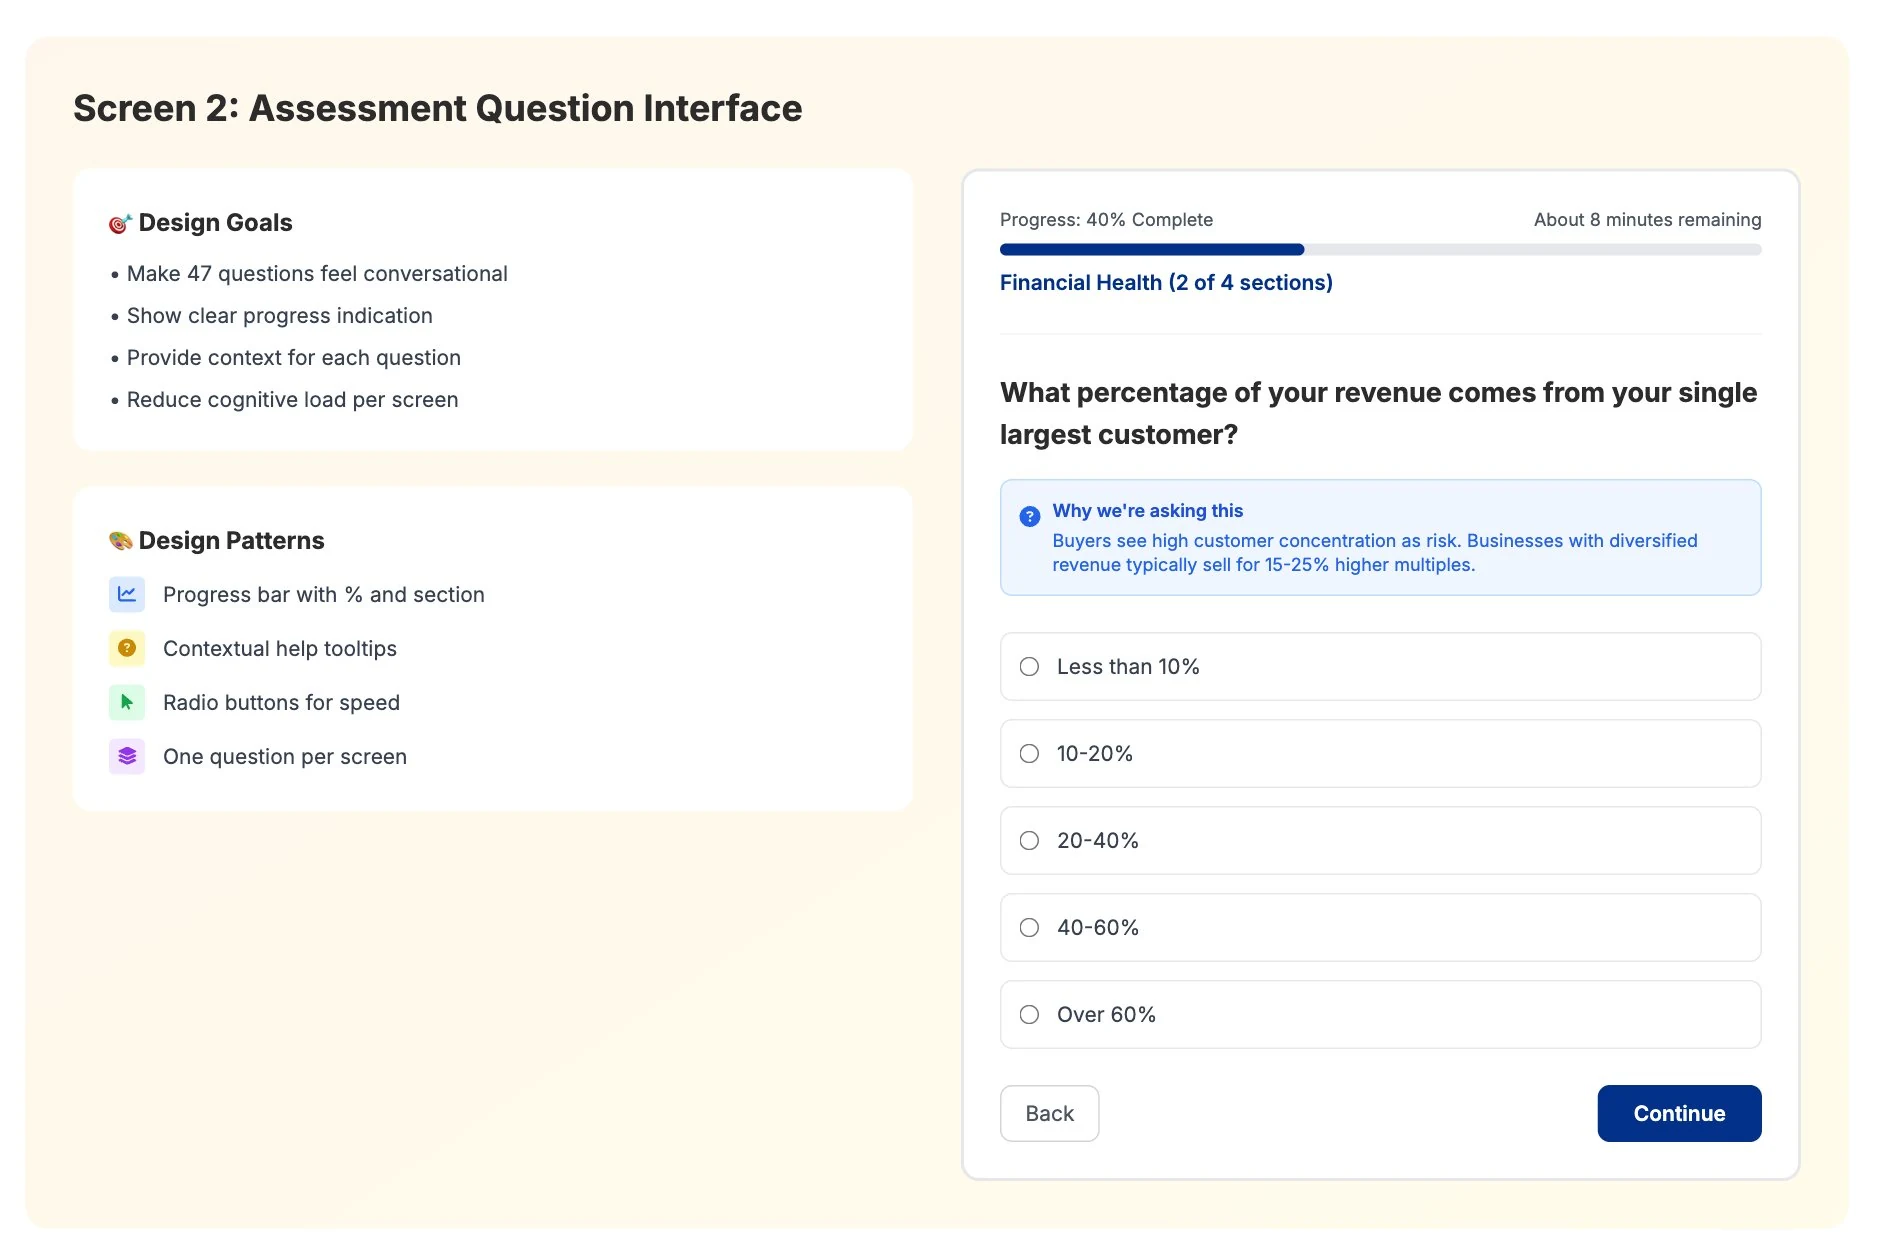
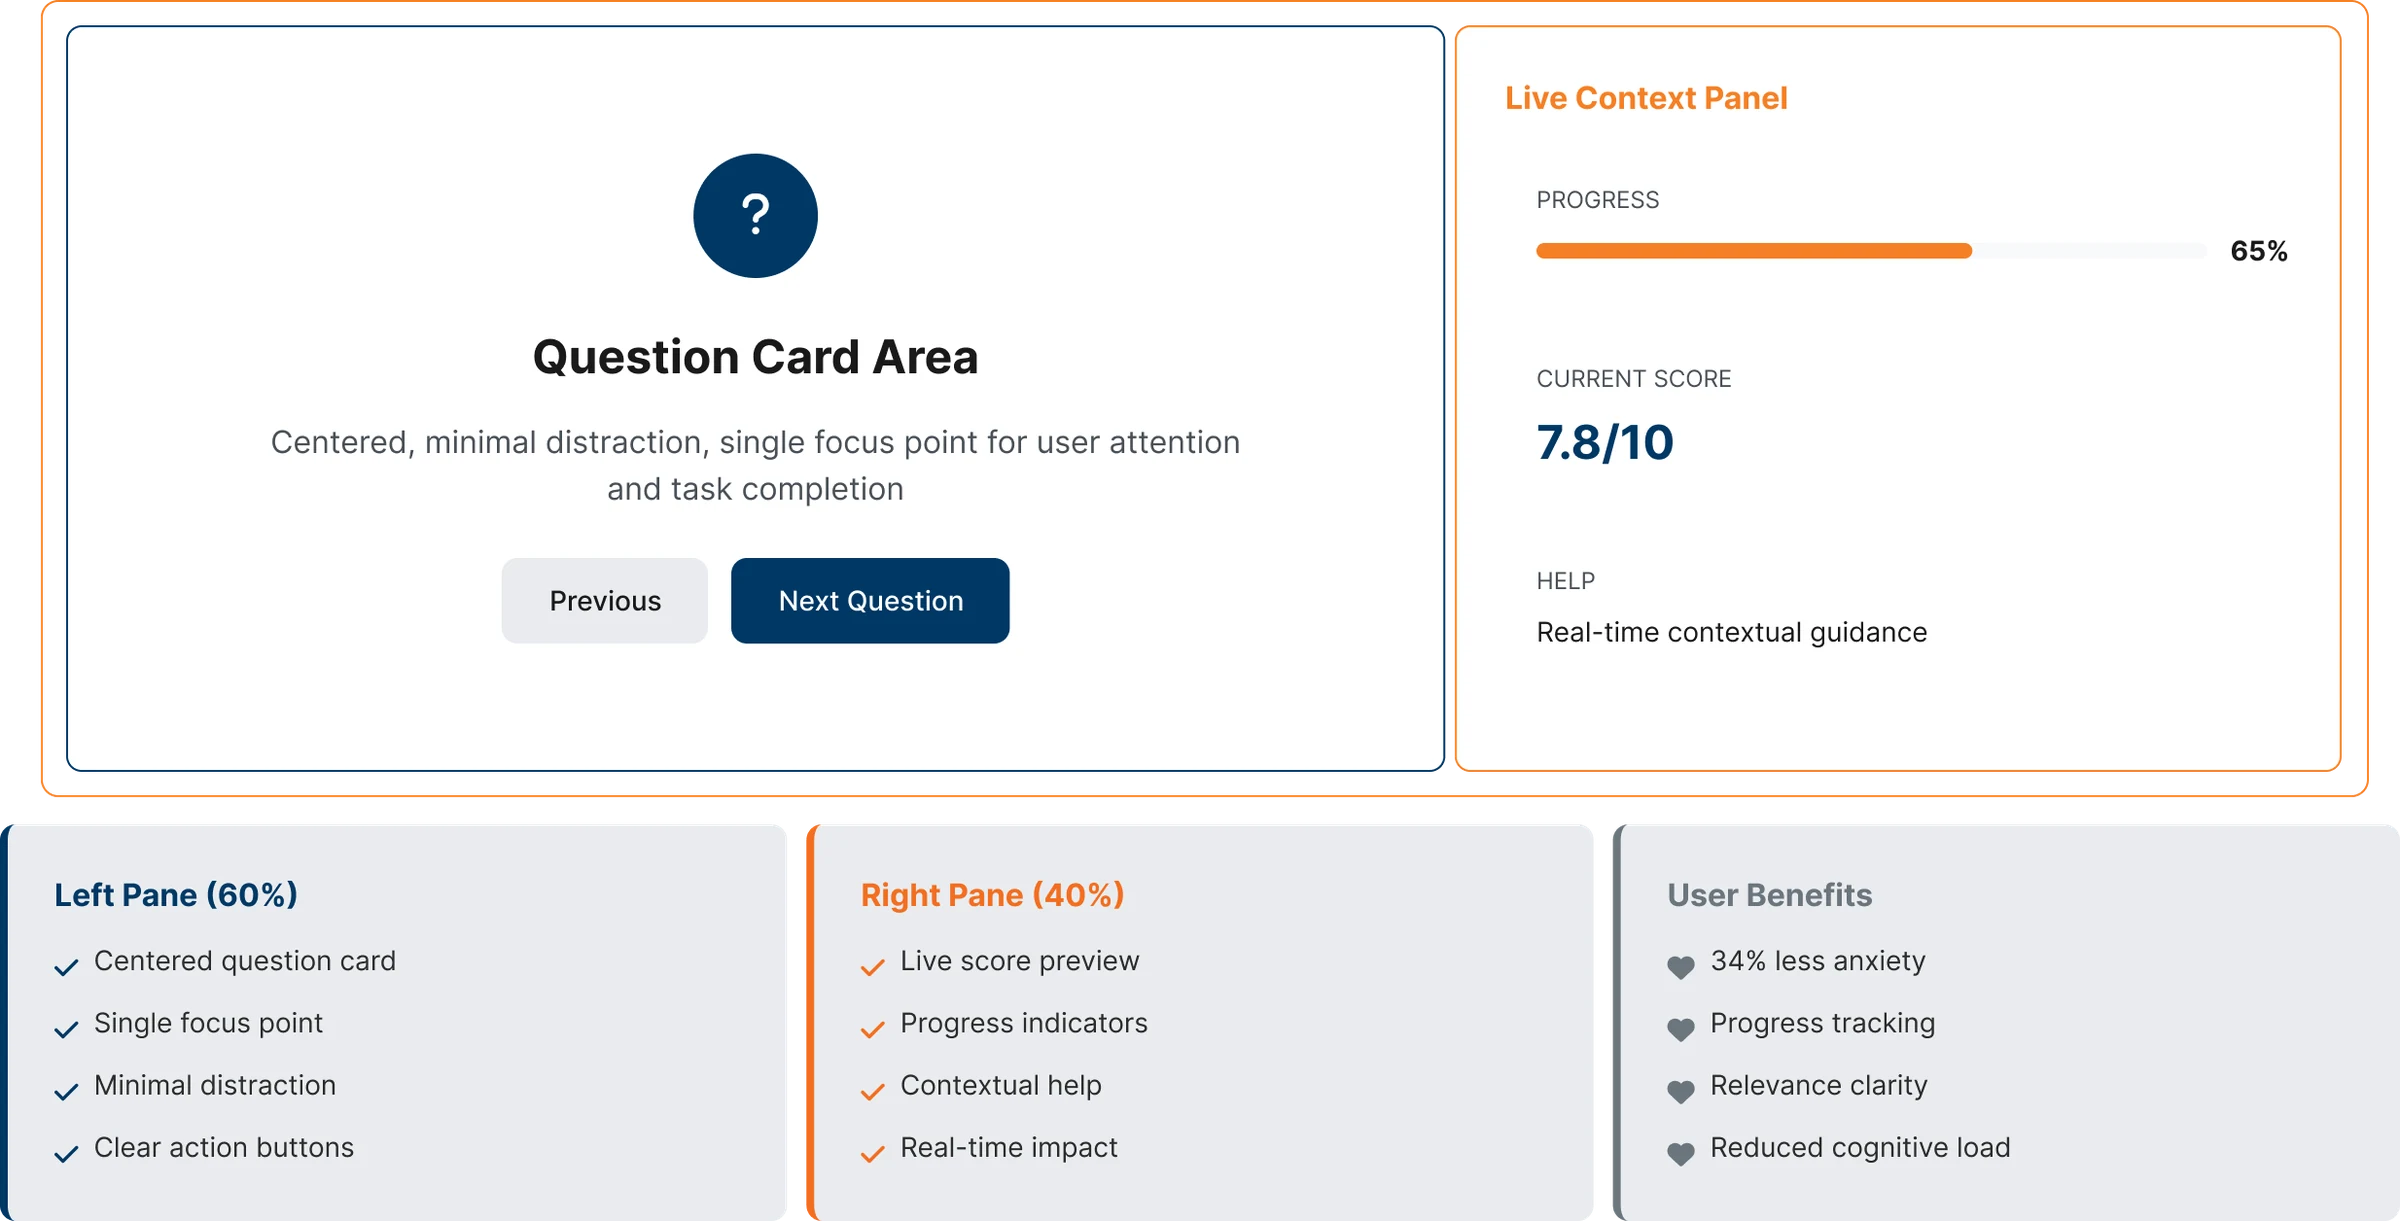
Screen 2
Assessment Question Interface
Design challenge: Make 47 questions feel conversational, not interrogative. Reduce cognitive load per screen. Show clear progress without anxiety.
60/40 SPLIT ARCHITECTURE
Left 60%: centered question card, single focus point, clear action buttons. Right 40%: live score preview, progress indicators, contextual help — showing real-time impact of each answer on the assessment.
Screen 2 — Assessment Question Interface
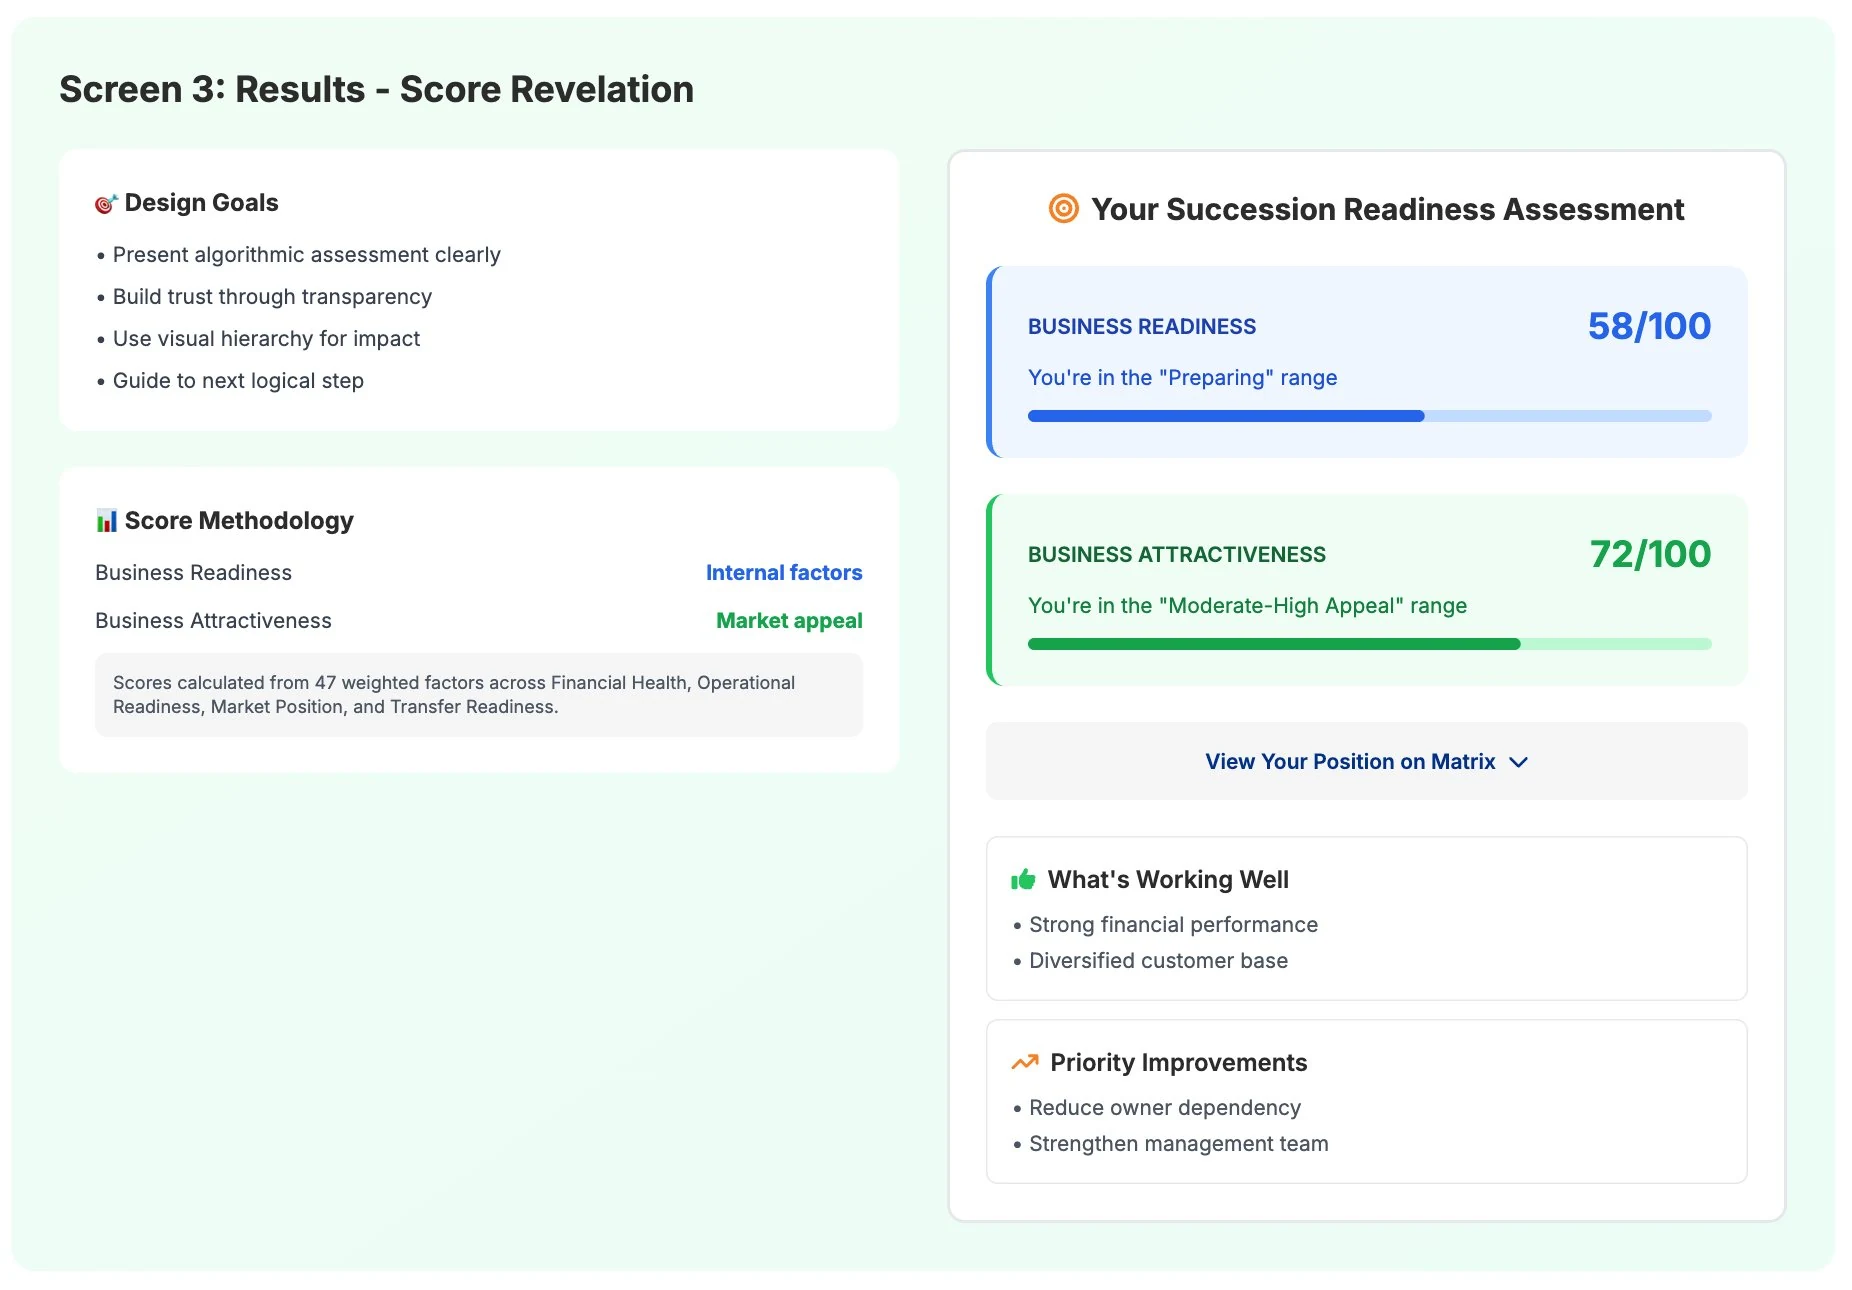
Screen 3
Score Revelation
Design challenge: Present algorithmic results without triggering defensiveness. Build trust by showing methodology — the algorithm must "show its work."
Design Decision: Use round numbers (58, not 58.3) to avoid false precision. Show both dimensions side-by-side with neutral color palette. Use descriptive labels, not just numbers.
Screen 3 — Results: Score Revelation
Screen 4
Assessment Timeline
Design challenge: Show the full journey in one view. Give owners context on where they are, what's feeding into their plan, and what's coming next — without overwhelming.
Tailored modular cards · Contextual help at every step · Progressive disclosure — owner sees only what's relevant to their current phase.
BOSS — Assessment
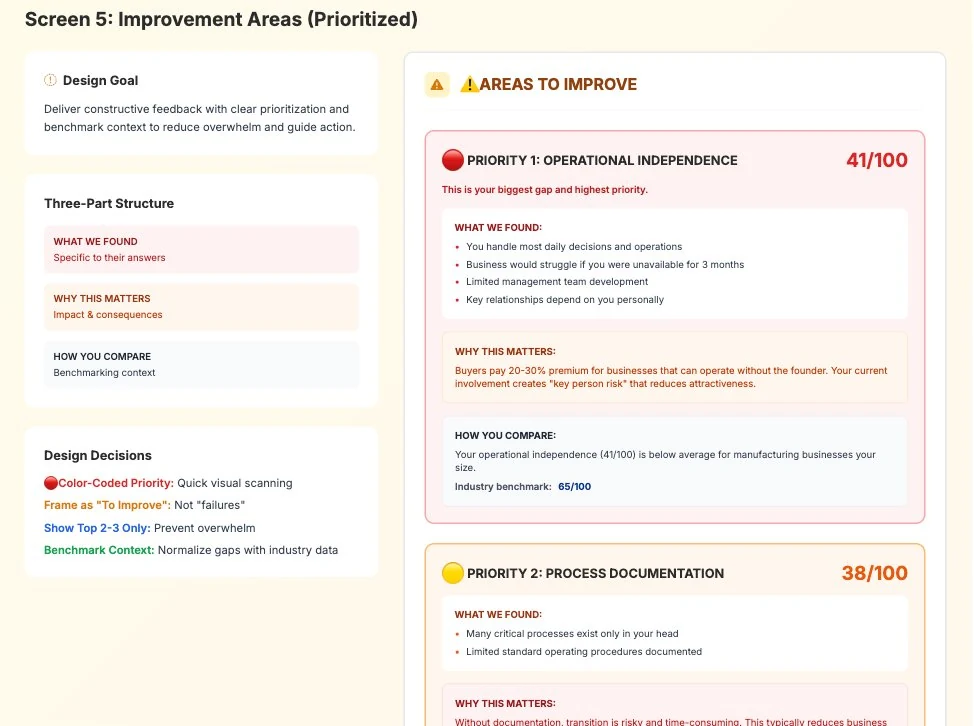
Screen 5
Strengths, Gaps & Advisor Match
Design challenge: Deliver constructive feedback without triggering defensiveness. Lead with what's working. Make gaps specific and actionable, not demoralizing.
83% action intent — 10/12 owners said they would take action within 30 days after seeing this screen.
BOSS — Readiness Score
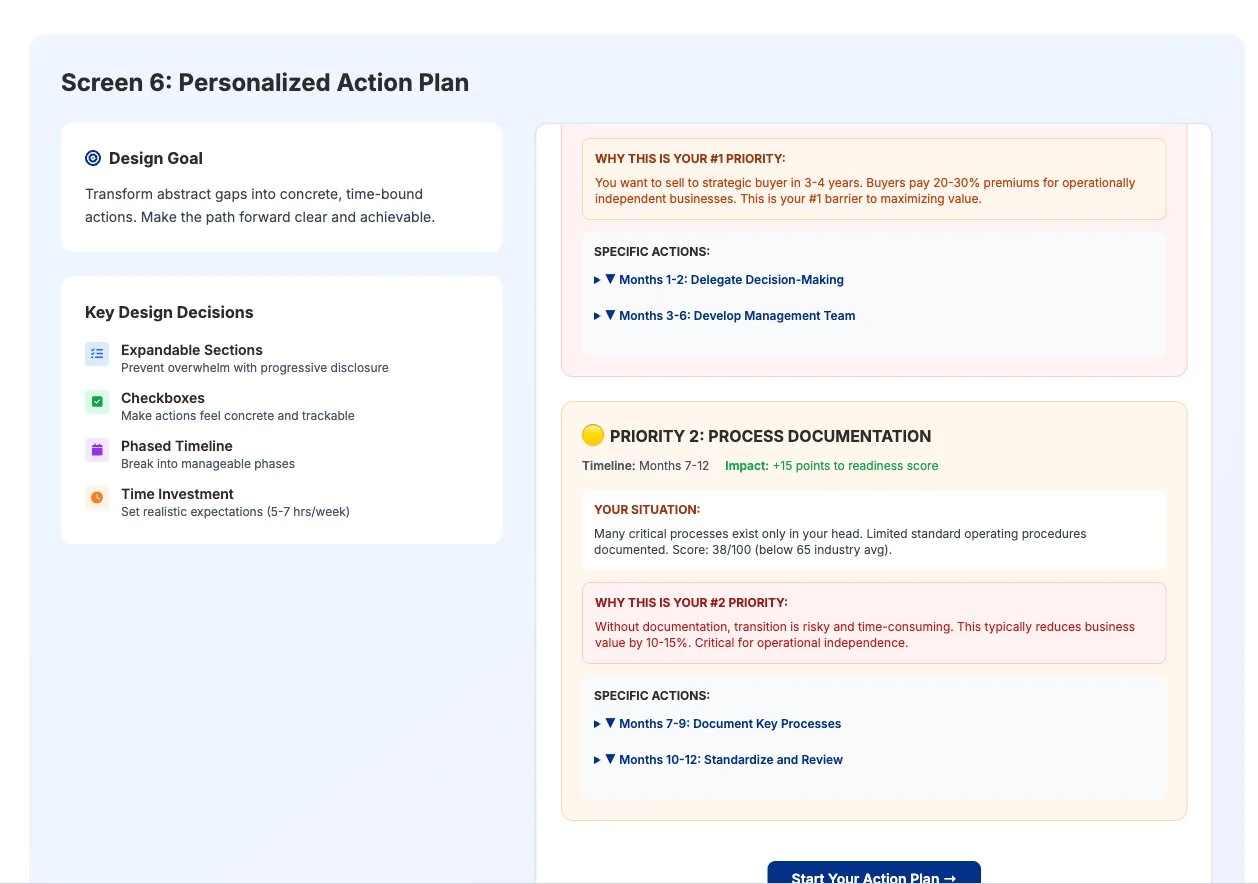
Screen 6
Personalized Action Plan
Design challenge: Transform abstract gap scores into concrete, time-bound actions owners can actually execute. Make "improve operational independence" feel achievable, not overwhelming.
KEY DESIGN DECISION
Expandable phase sections prevent overwhelm — owners see Months 1–2 first, not the full 18-month roadmap. Success metrics per phase provide clear completion signals. Every action connects back to their specific situation.
BOSS — Your Action Plan
05.2Information Architecture & User Flows
The Unprepared Owner Path
Unlike traditional IA focused on content hierarchy, I designed two parallel structures: the algorithmic assessment flow and the supporting content ecosystem. Abstract logic becomes real when you trace a specific person through it. The left diagram maps John — a 52-year-old restaurant owner — through the full system, showing exactly how the algorithm detects risk, routes intelligently, and creates a warm handoff. The right diagram shows the underlying assessment flow architecture: how 47 rules worth of data collection are sequenced using progressive disclosure and adaptive branching to feel conversational, not interrogative.
Why This Scenario Matters
John is not an edge case — he is the modal user. Financially stable, operationally dependent, emotionally unprepared. The system's ability to surface his hidden critical moment and route him without human intervention is the core value proposition made visible.
01
Critical Moment
System detects what John couldn't self-report
He clicks "I'm not sure" — system provides context. He reconsiders: "No, I'm needed for most major decisions." Flag: High Owner-Dependence triggered.
02
Adaptive Routing
Score reveals the full picture
Readiness 52/100 · Attractiveness 68/100 · "Building" quadrant. Gaps: Operational Independence (41), Systems (38). Dual-score captures what a single number would miss.
03
Warm Handoff
System closes the loop automatically
PDF generated. John segmented. Sarah (RM) gets a dashboard notification with full context — she arrives already briefed, not starting cold.
“If you were unable to work for 3 months, could your business operate successfully?”Clicks “I’m not sure”, reads the context, then: “No, I’m needed for most major decisions.”
5–7 year timeline, wants to sell to an outside buyer.
Explains time, commitment and confidentiality up front.
Easy questions first, to build confidence.
Scores financial stability: 72.
Offers context on “I’m not sure”.High owner-dependence · Rule 1.3 Readiness −20 · adds management questions
Timeline and exit type feed persona routing.
5-second “Analyzing your business…” pause while the rules run.
Places John in the “Building” quadrant.
Adds John to the “Building” segment, schedules a quarterly reassessment, notifies his relationship manager.
Sarah, relationship manager
Sends the invite: “Can you take 20 minutes to complete this assessment?”
Not involved while John assesses himself. No qualification calls, no cold first meeting.
Gets a dashboard notification with talking points. Arrives already briefed.
Why this wasn’t lead routing
Advisor matching was built for the owner, not for the sales pipeline. Before any advisor was involved, the owner already had their score, their gaps and a plan they could act on. Every match was to a specialist on PNC’s own Succession Advisory team, never a third party, and that advisor arrived already briefed. The first meeting started with planning, not qualification.
05.3Architecture Design
Screens Evolution & Layout Architecture
Single-page vs multi-page wasn't an aesthetic decision — testing showed it. Users needed focus during the assessment and density during results. The same layout couldn't serve both cognitive modes. So the architecture split to match what the user actually needed at each stage.
Core Design Challenge
Users needed different cognitive modes at different stages: deep focus during assessment, comprehensive analysis during results review. A single layout approach failed to serve both needs. The assessment phase required singular focus with minimal distraction. The results phase demanded information density for complex decision-making and data synthesis.
Assessment Phase
Required singular focus with minimal distraction while maintaining progress awareness
Results Phase
Demanded information density for complex decision-making and data synthesis
01 / Challenge
Balancing Focus and Context
Users needed different cognitive modes at different stages: deep focus during assessment, comprehensive analysis during results review. A single layout approach failed to serve both needs effectively.
02 / Assessment Layout
60/40 Split Architecture
The assessment screens employed a 60/40 split layout optimized for focused task completion while maintaining contextual awareness. Left 60% centered the question card with single-focus design. Right 40% displayed live score previews and contextual help.
Left 60% — centered question card · single focus point · radio buttons · clear action buttons. Right 40% — live score preview · progress indicators · contextual help · real-time impact.
Outcome: 34% less assessment anxiety · 68% reduction in mid-assessment abandonment · 41% improvement in relevance clarity.
05.4Component Library & Design System
Design System — Ensuring Consistency at Scale
135+ screens across 4 persona pathways, 9 scoring zones, and 3 user types (owner, RM, advisor) created a real consistency problem. Without a system, the same component would render differently across assessment, results, and action plan contexts — breaking the trust signal the product depended on. The design system solved three specific problems: score presentation had to look neutral, not alarming; recommendation cards had to scale from 1 to 15 items without layout collapse; and advisor match components had to work across 5 advisor specialisms with different credential structures.
Color Palette
Primary Brand
Primary Blue
#1E40AF
Text Dark
#111827
Info Blue
#3B82F6
Conveys trust and professionalism. Used for all interactive elements and score displays to maintain neutrality.
Neutral Grays
Primary Text
#111827
Secondary
#6B7280
Borders
#D1D5DB
Background
#F9FAFB
Gray palette provides professional foundation while allowing semantic colors to communicate clearly when needed.
Semantic Colors
Success
#10B981
Moderate
#F59E0B
High Priority
#EF4444
Red, orange, and green reserved exclusively for priority levels in action plans. Never used for scores themselves.
Never Use Red/Green for Scores
Avoids judgmental connotations. All scores use neutral Primary Blue to maintain objectivity and reduce assessment anxiety. A 41/100 score in red would trigger defensive reactions before the owner reads the explanation.
Semantic Colors for Priority Only
Red, orange, and green are reserved exclusively for priority levels in action plans and recommendations — never for scores or general UI elements. This creates a clear visual language: when you see red, it means "act on this first."
Blue for All Assessment Elements
Progress bars, score displays, and interactive elements all use Primary Blue for a consistent, neutral experience. This deliberately avoids making high scores feel "good" or low scores feel "bad" — the assessment is diagnostic, not evaluative of the owner's worth.
Typography Hierarchy
H1 · Inter Bold · 32px
Assess Your Business Succession Readiness
H2 · Inter SemiBold · 24px
Financial Health Assessment
H3 · Inter SemiBold · 20px
Revenue Growth Trend
Body · Inter Regular · 16px · Line Height 1.6
Optimised for long assessment sessions. 1.6 line-height maintains comfort across 47 questions.
Typography rationale: Inter conveys reliability and professionalism appropriate for financial services without being corporate-stiff. Optimized readability: line height of 1.6 for body text ensures comfortable reading during long assessment sessions. Performance focused: Google Fonts delivery ensures fast loading and consistent rendering across devices. font-family: 'Inter', sans-serif
05.5Final Deliverable
Actual Screens
Representative production screens from the 135+ screen system. Branding revised due to intellectual property considerations.
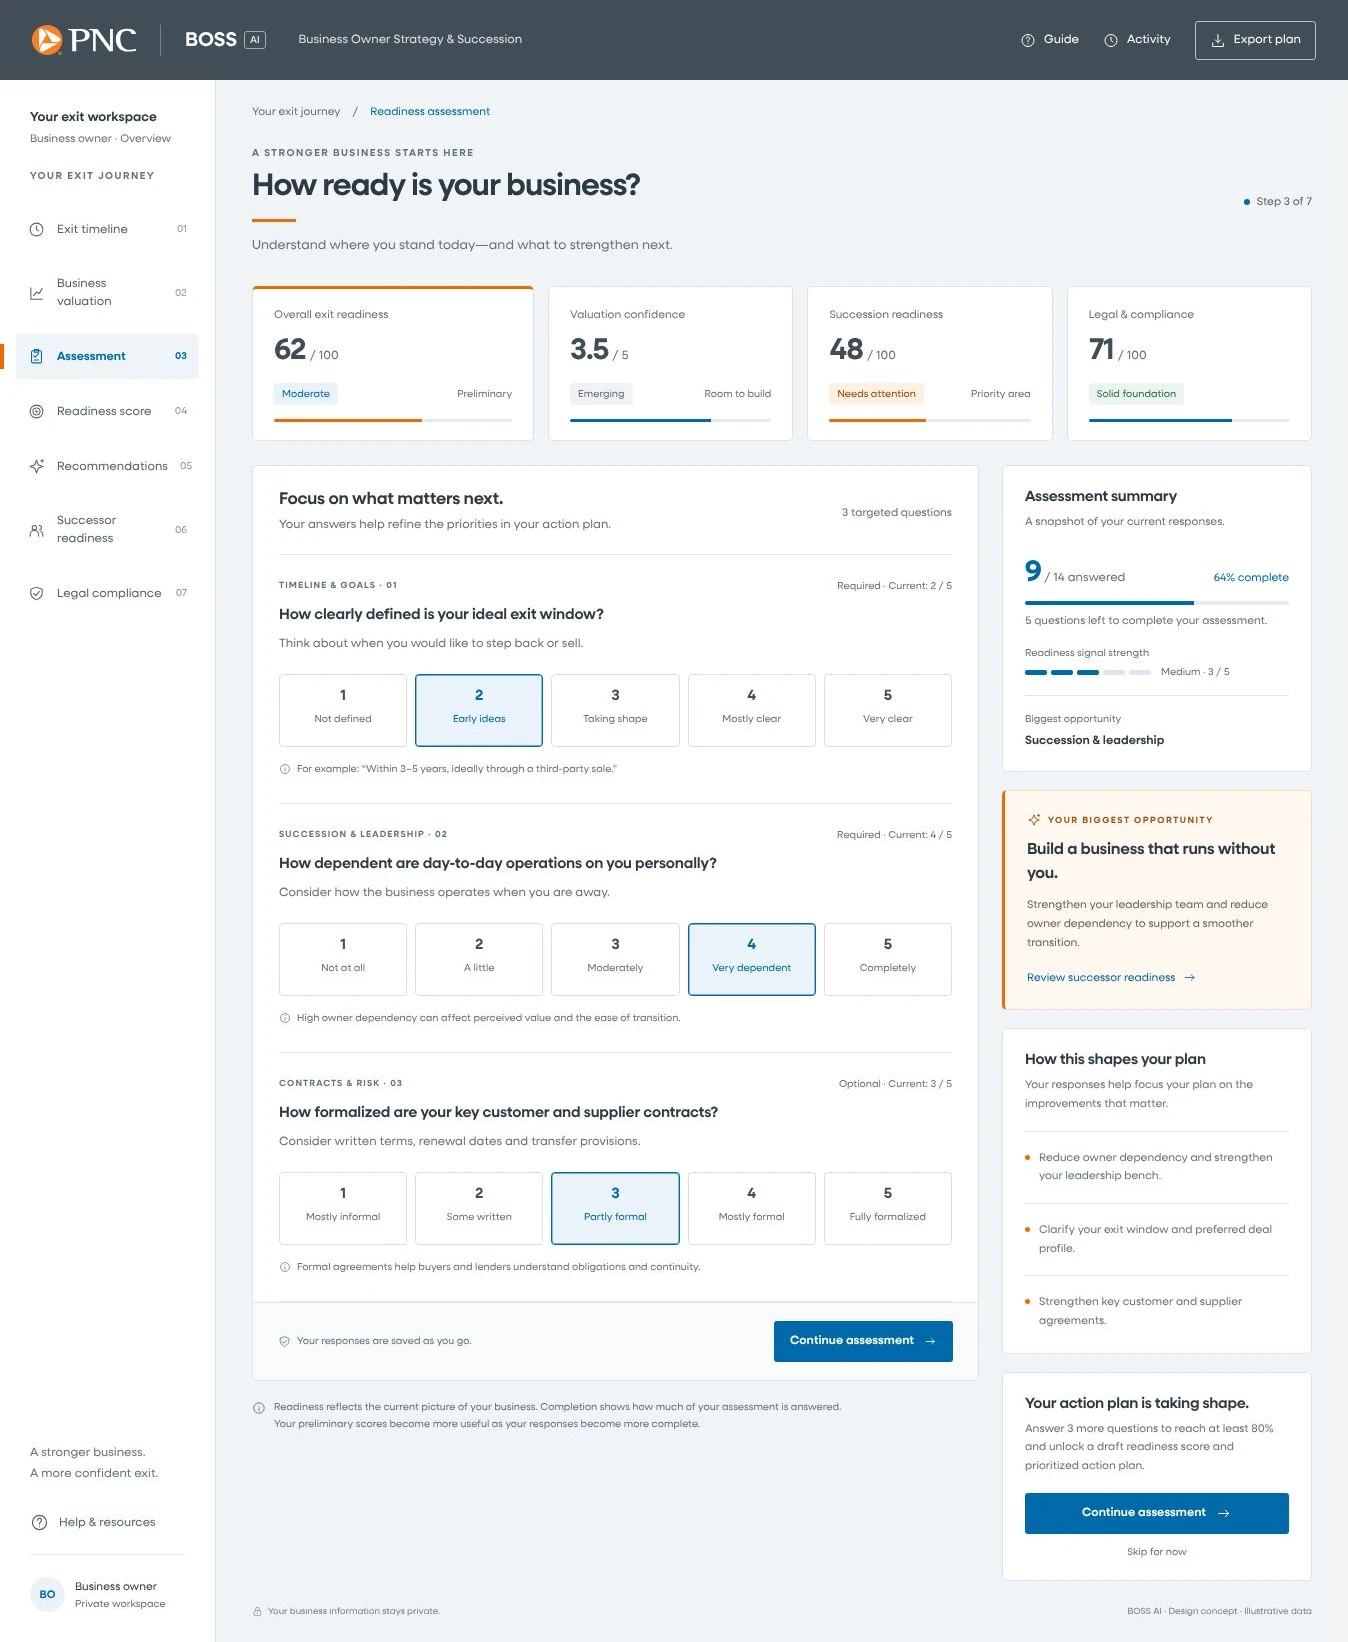
Four live readiness dimensions: Overall Readiness, Valuation Confidence, Succession Readiness, Legal & Compliance. Adaptive questions refine the score in real time. Right panel surfaces assessment summary and biggest drag.
BOSS — Readiness Assessment
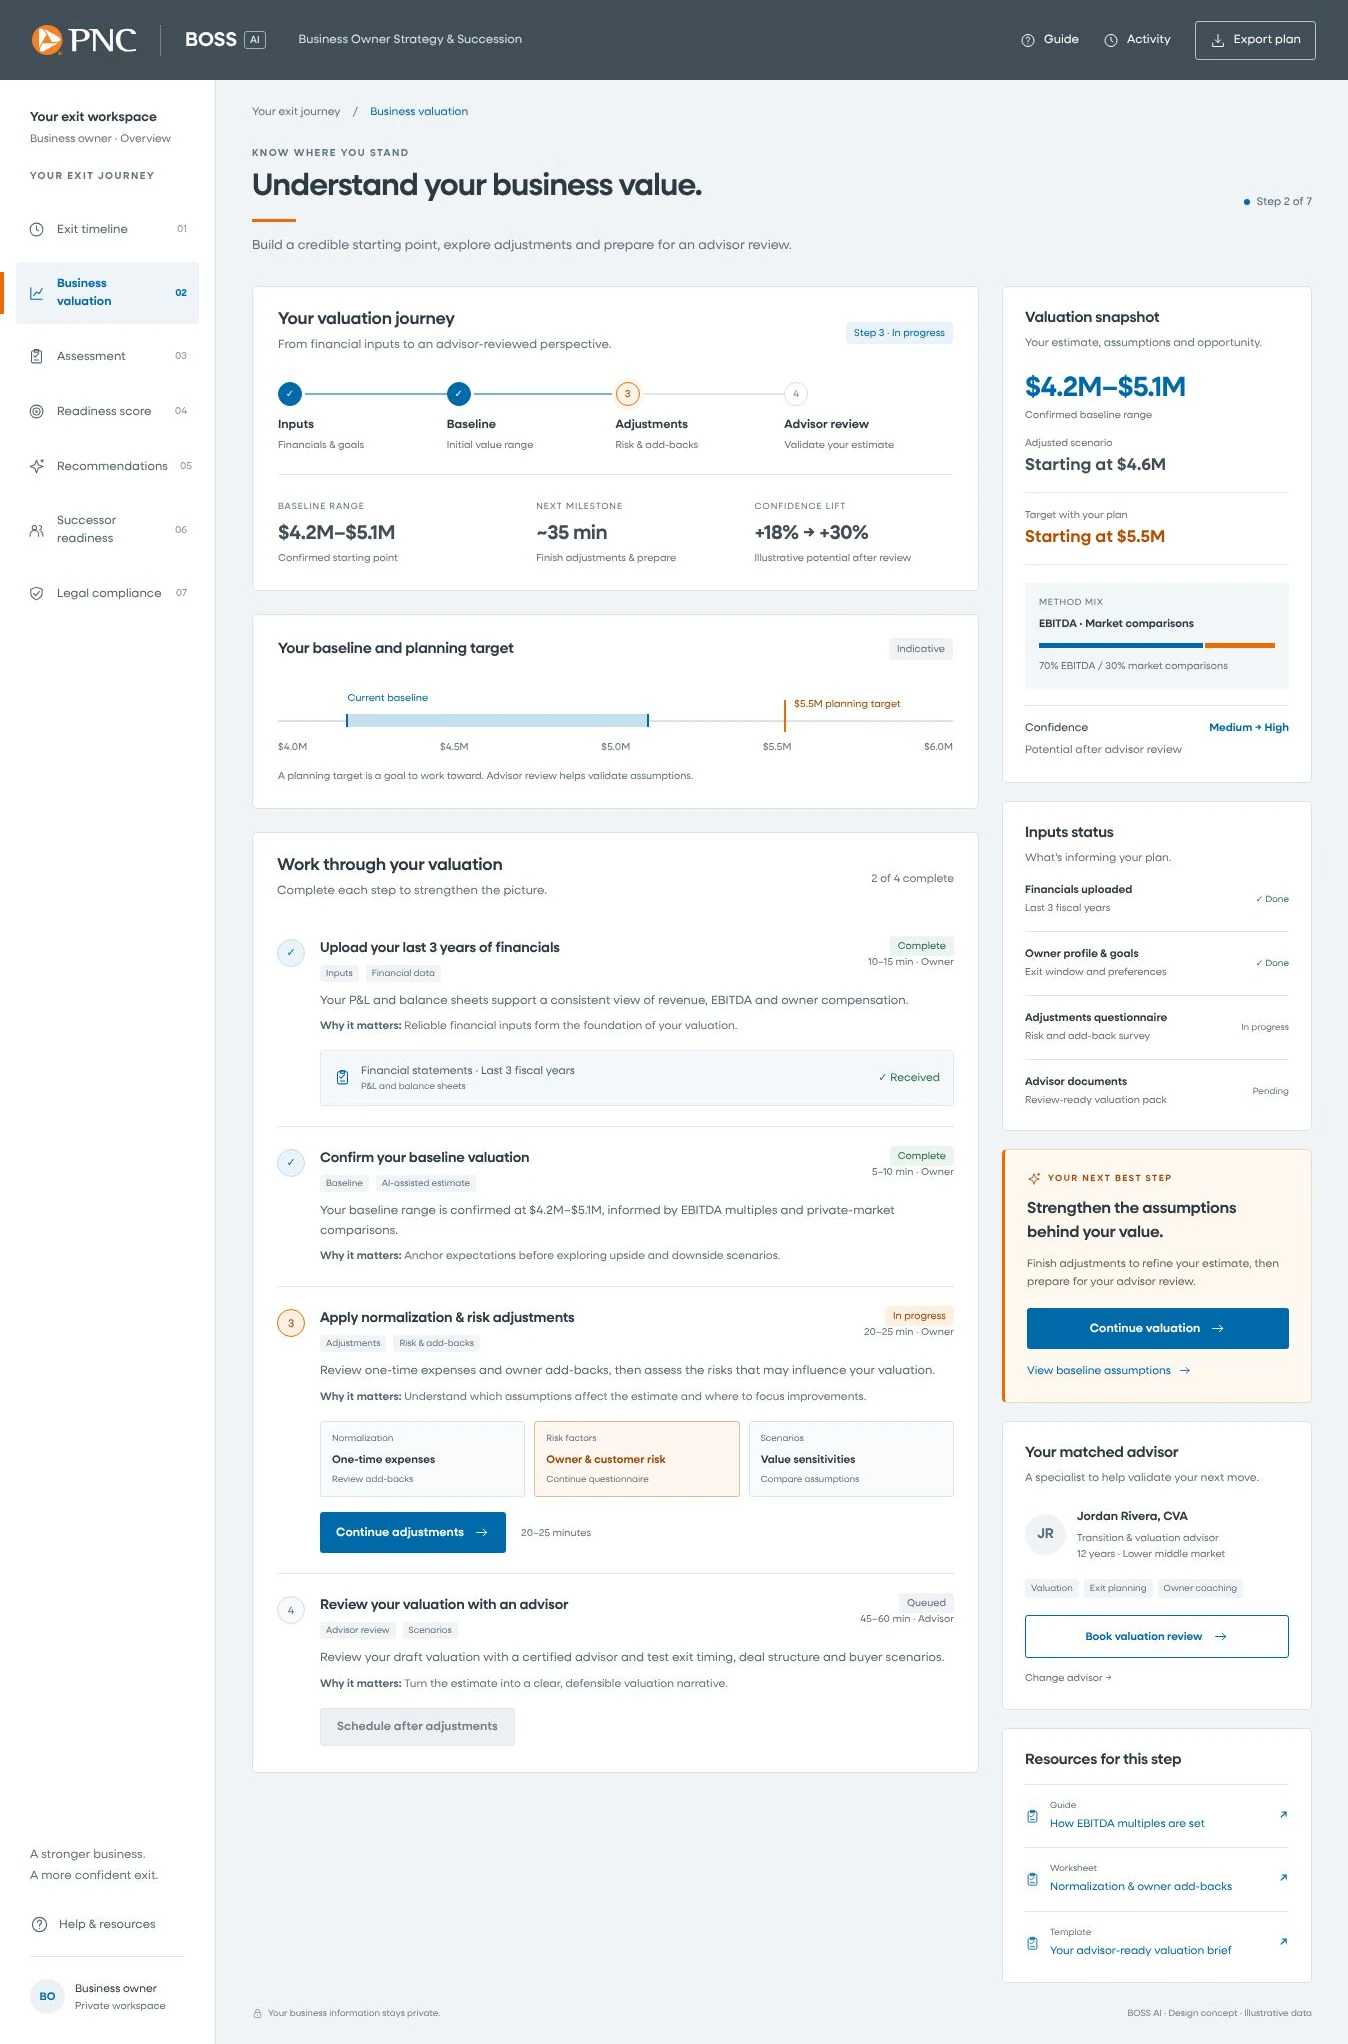
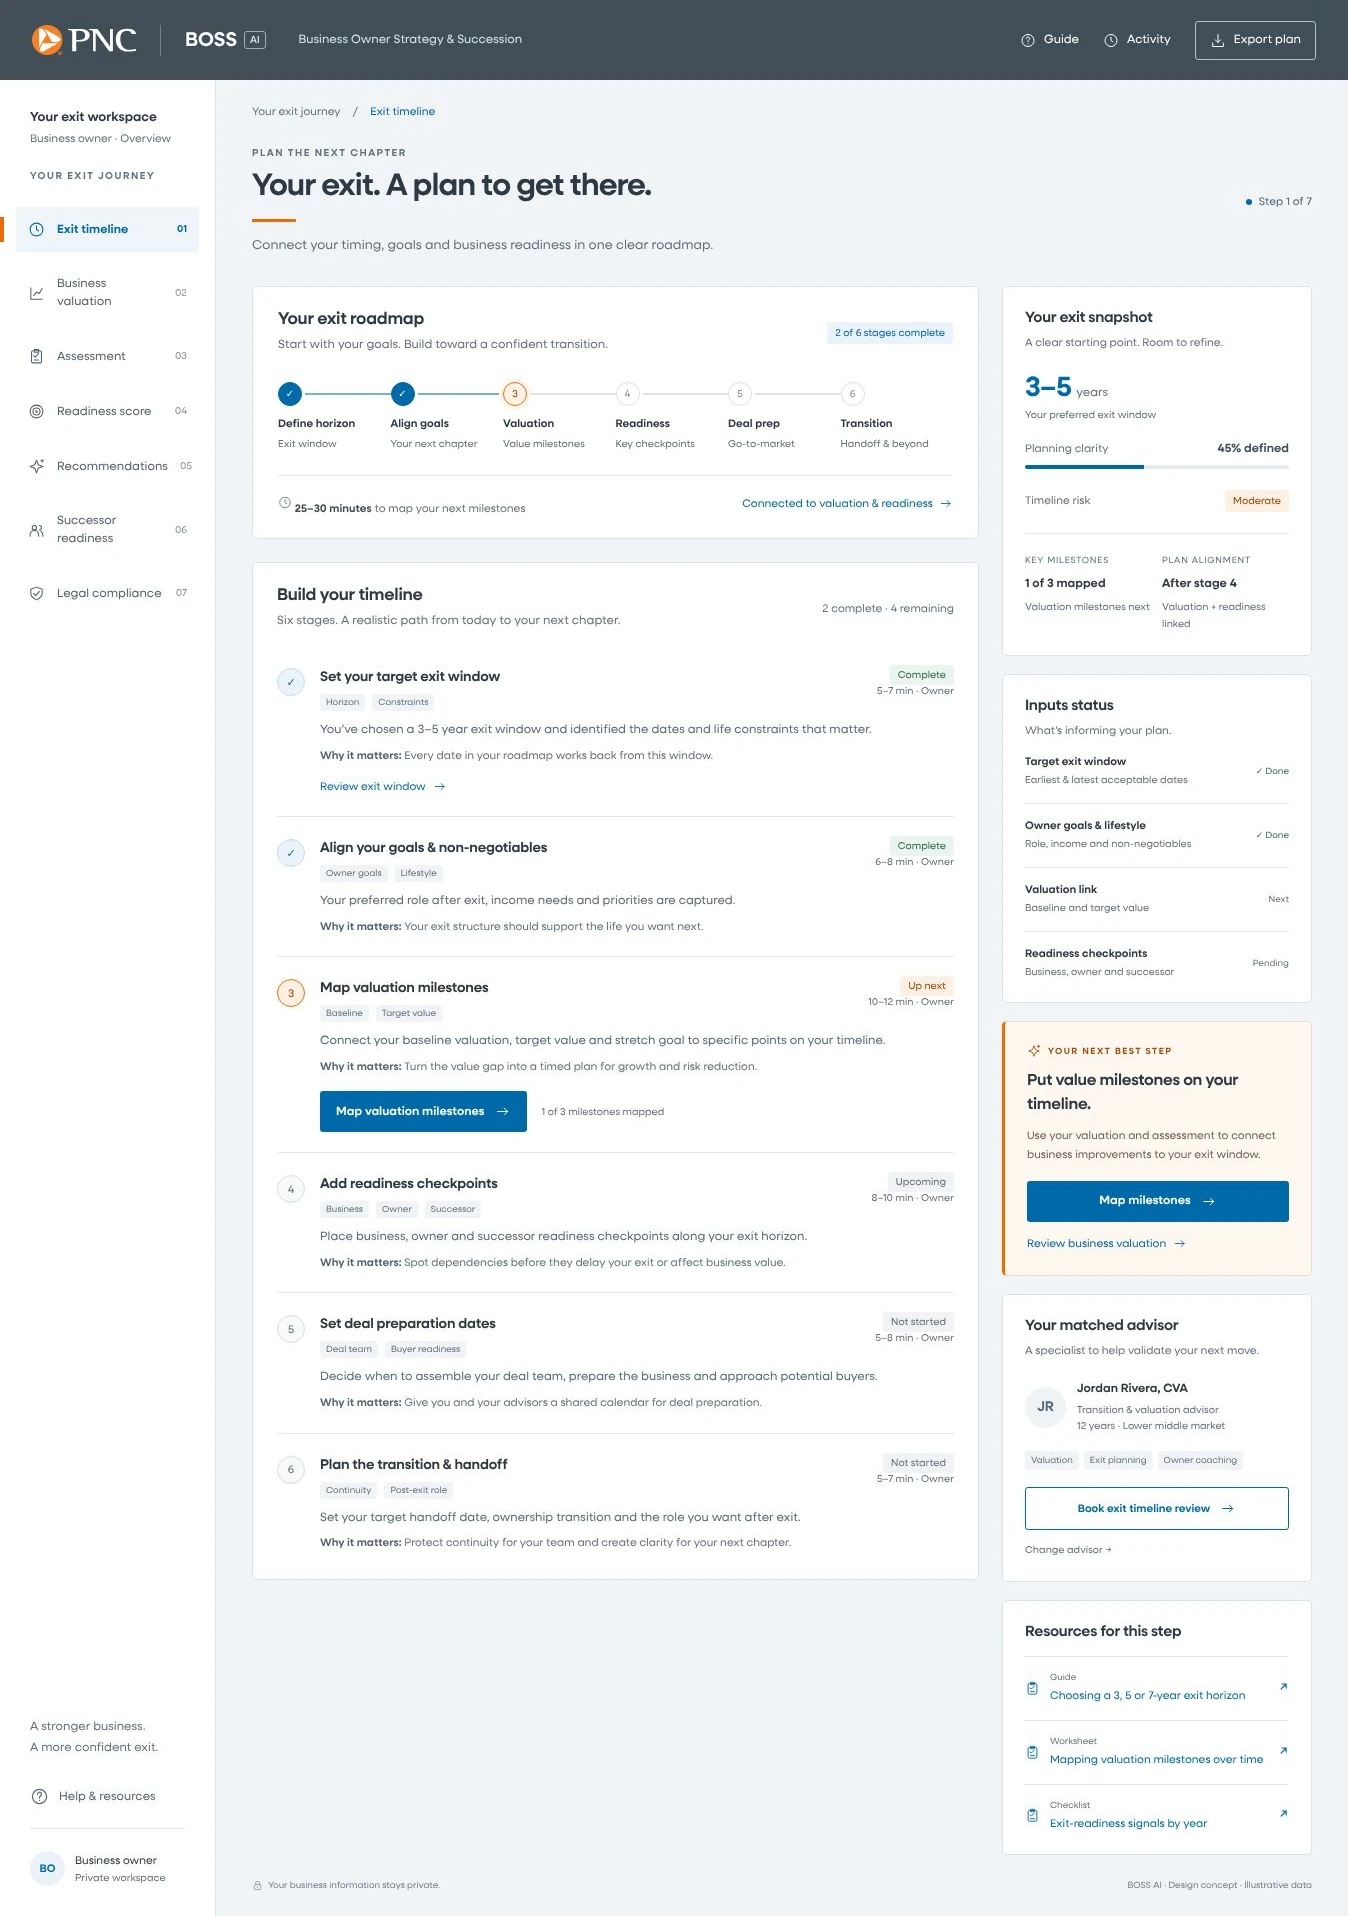
Screen · Business Valuation Timeline
Business Valuation — Guided 4-Step Valuation Path
End-to-end valuation workflow: Inputs → Baseline → Adjustments → Advisor review. Valuation snapshot shows range ($4.2M–$5.1M) and target with plan. Matched advisor surfaces based on business size and deal profile.
BOSS — Business Valuation
Screen · Exit Timeline Planner
Exit Timeline — Date-Driven 6-Stage Roadmap
Six stages from Define horizon to Transition. Exit snapshot tracks clarity and timeline risk. All dates back-solve from the owner's preferred exit window. Matched advisor and resources surface at point of need.
BOSS — Exit Timeline
Screen Note
Screen examples shown are limited due to client confidentiality. These represent the design system and approach across 135+ production screens. Branding has been revised due to intellectual property considerations.
06Chapter 06 of 06
Impact & learnings
Measured by owners reaching the right advisor at the right time, not by pages read.
Three rounds. Algorithm accuracy first — does the engine match what advisors actually recommend? Then user trust — will owners believe a score? Then RM usability — does this make advisors' jobs easier or harder? Each round had a specific question. Each one changed something.
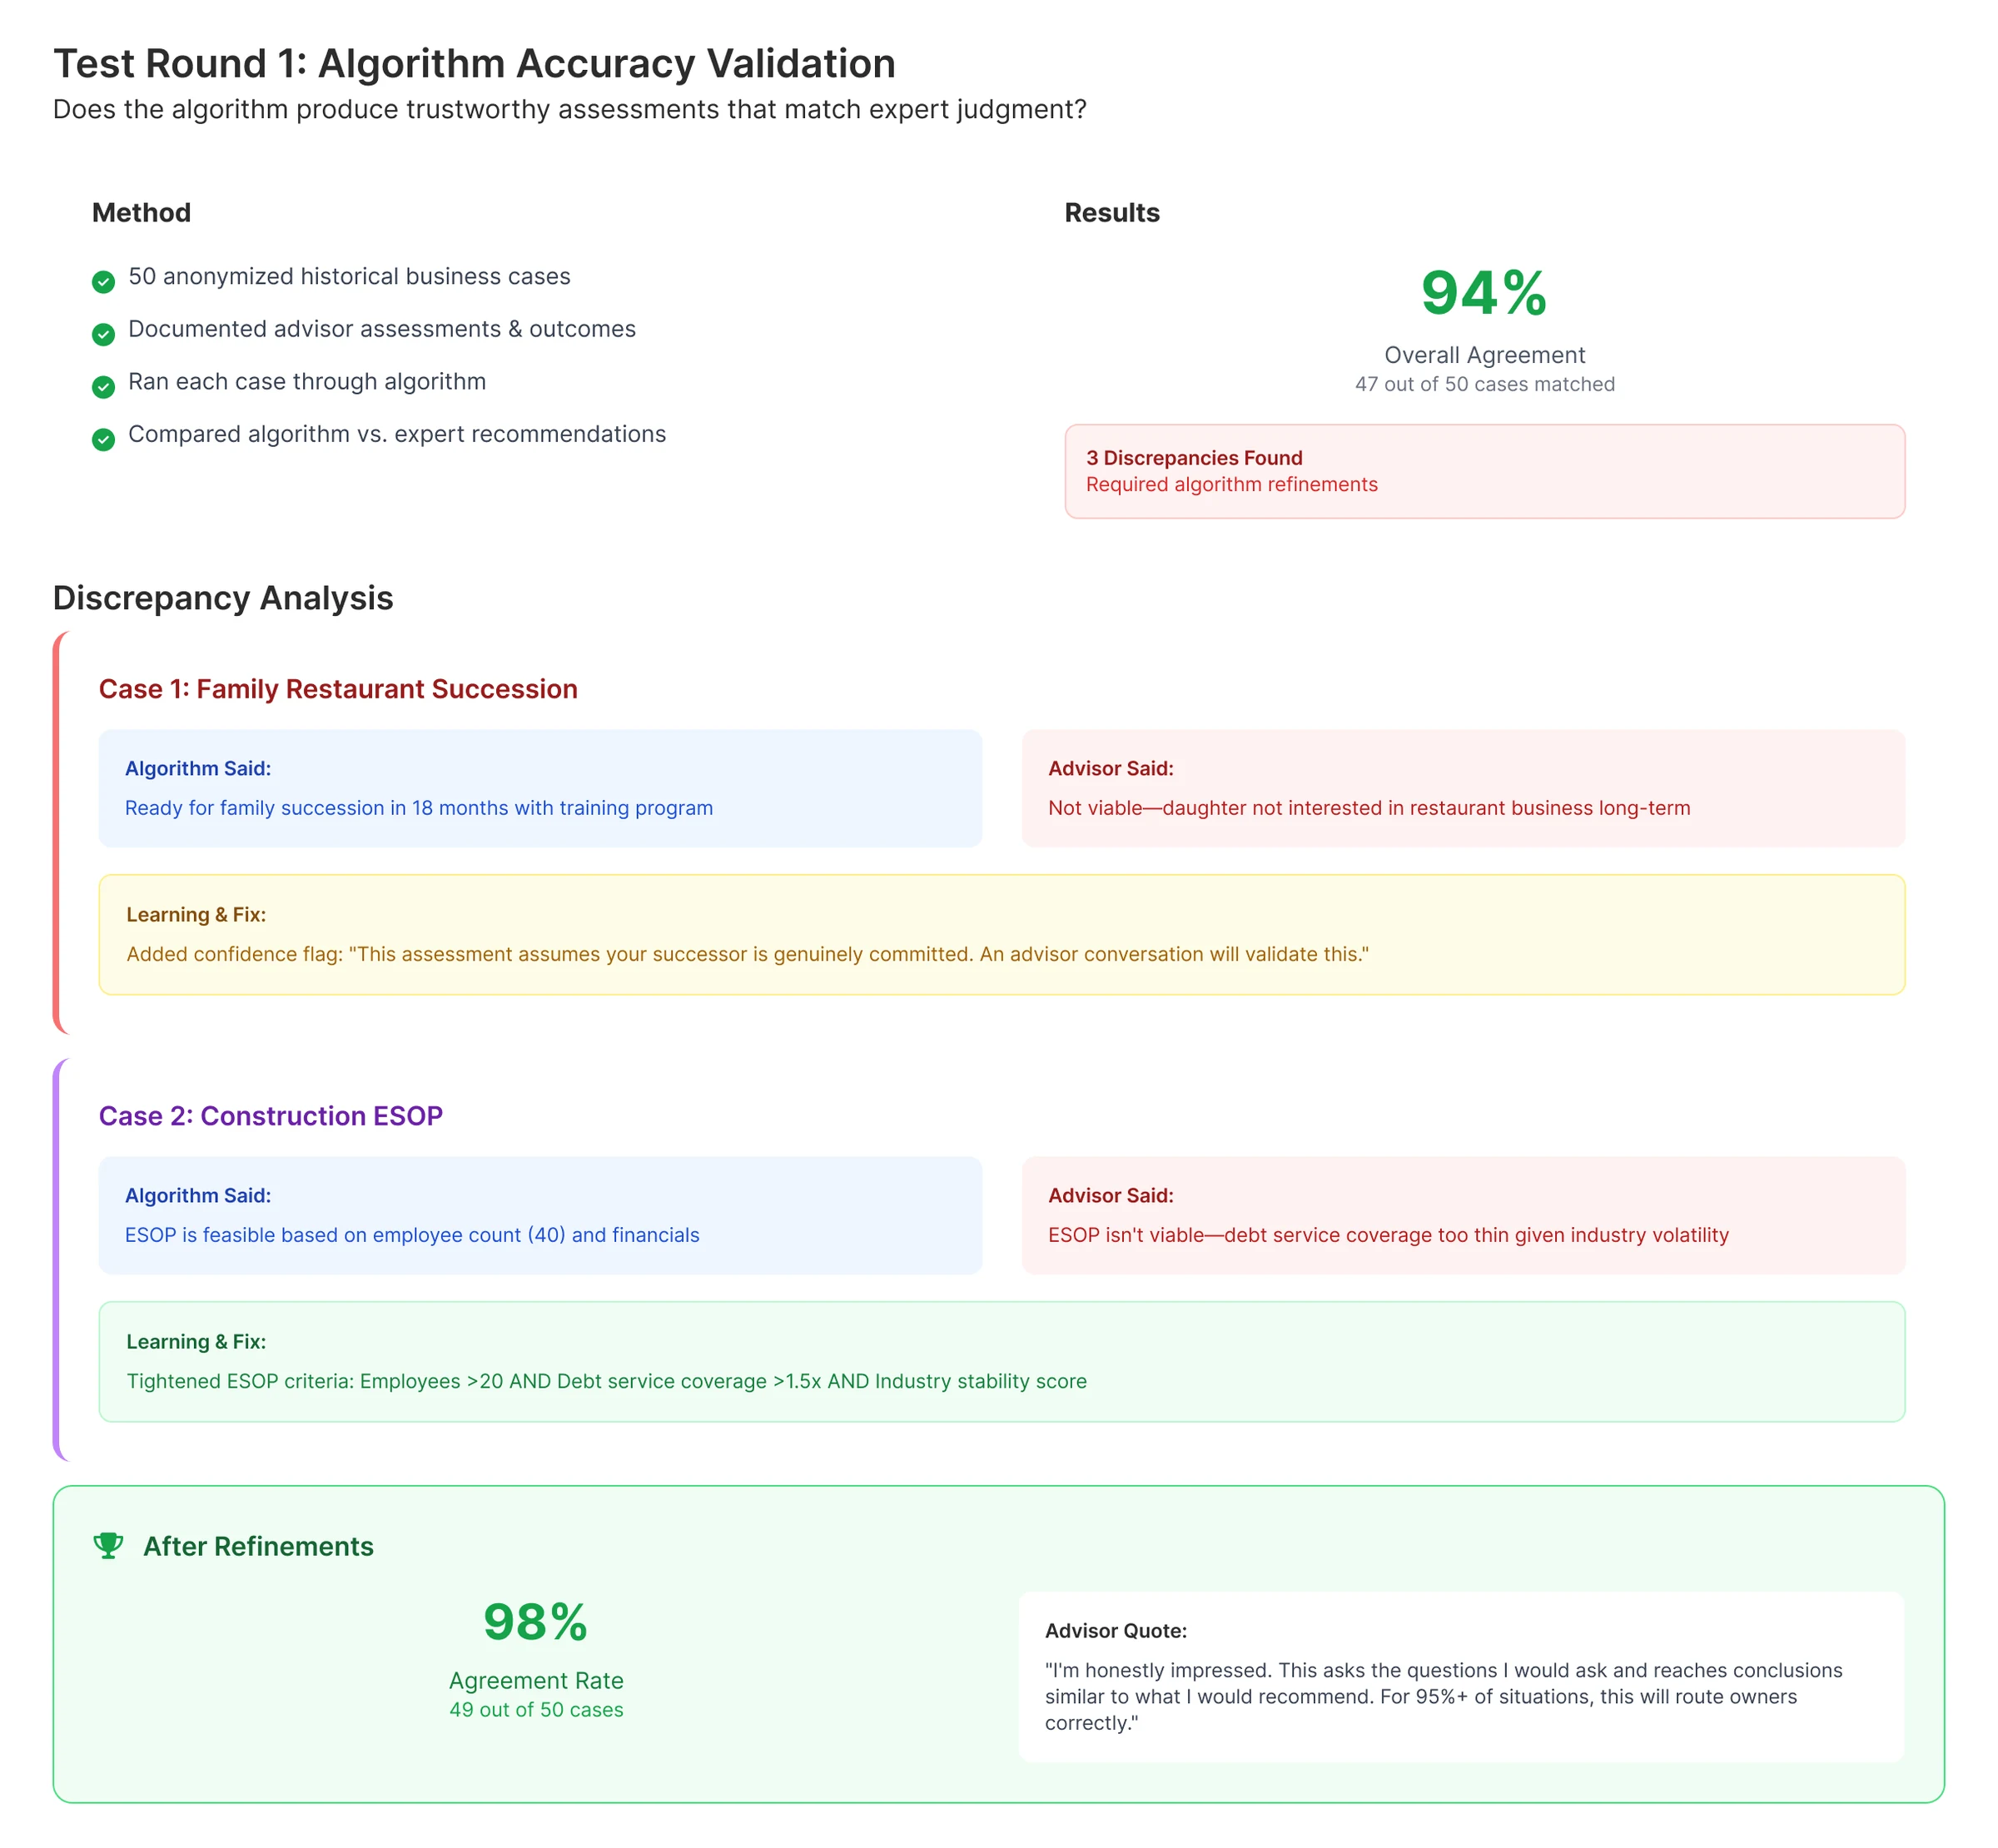
Round 1 — 94% algorithm accuracy on first pass; 98% after two targeted refinements
Round 3 — 9.1/10 RM confidence; 3x improvement in net client engagement (8% → 25%)
Round 01 · Algorithm Accuracy Validation
Does the algorithm match expert judgment?
94%
47 out of 50 historical cases matched advisor recommendations
FOUNDFamily Restaurant: system assumed successor commitment. ESOP case: debt service coverage not factored.
FIXAdded successor commitment flag. Tightened ESOP criteria with debt coverage threshold.
RESULT98% agreement after refinements. Advisor: "For 95%+ of situations, this will route owners correctly."
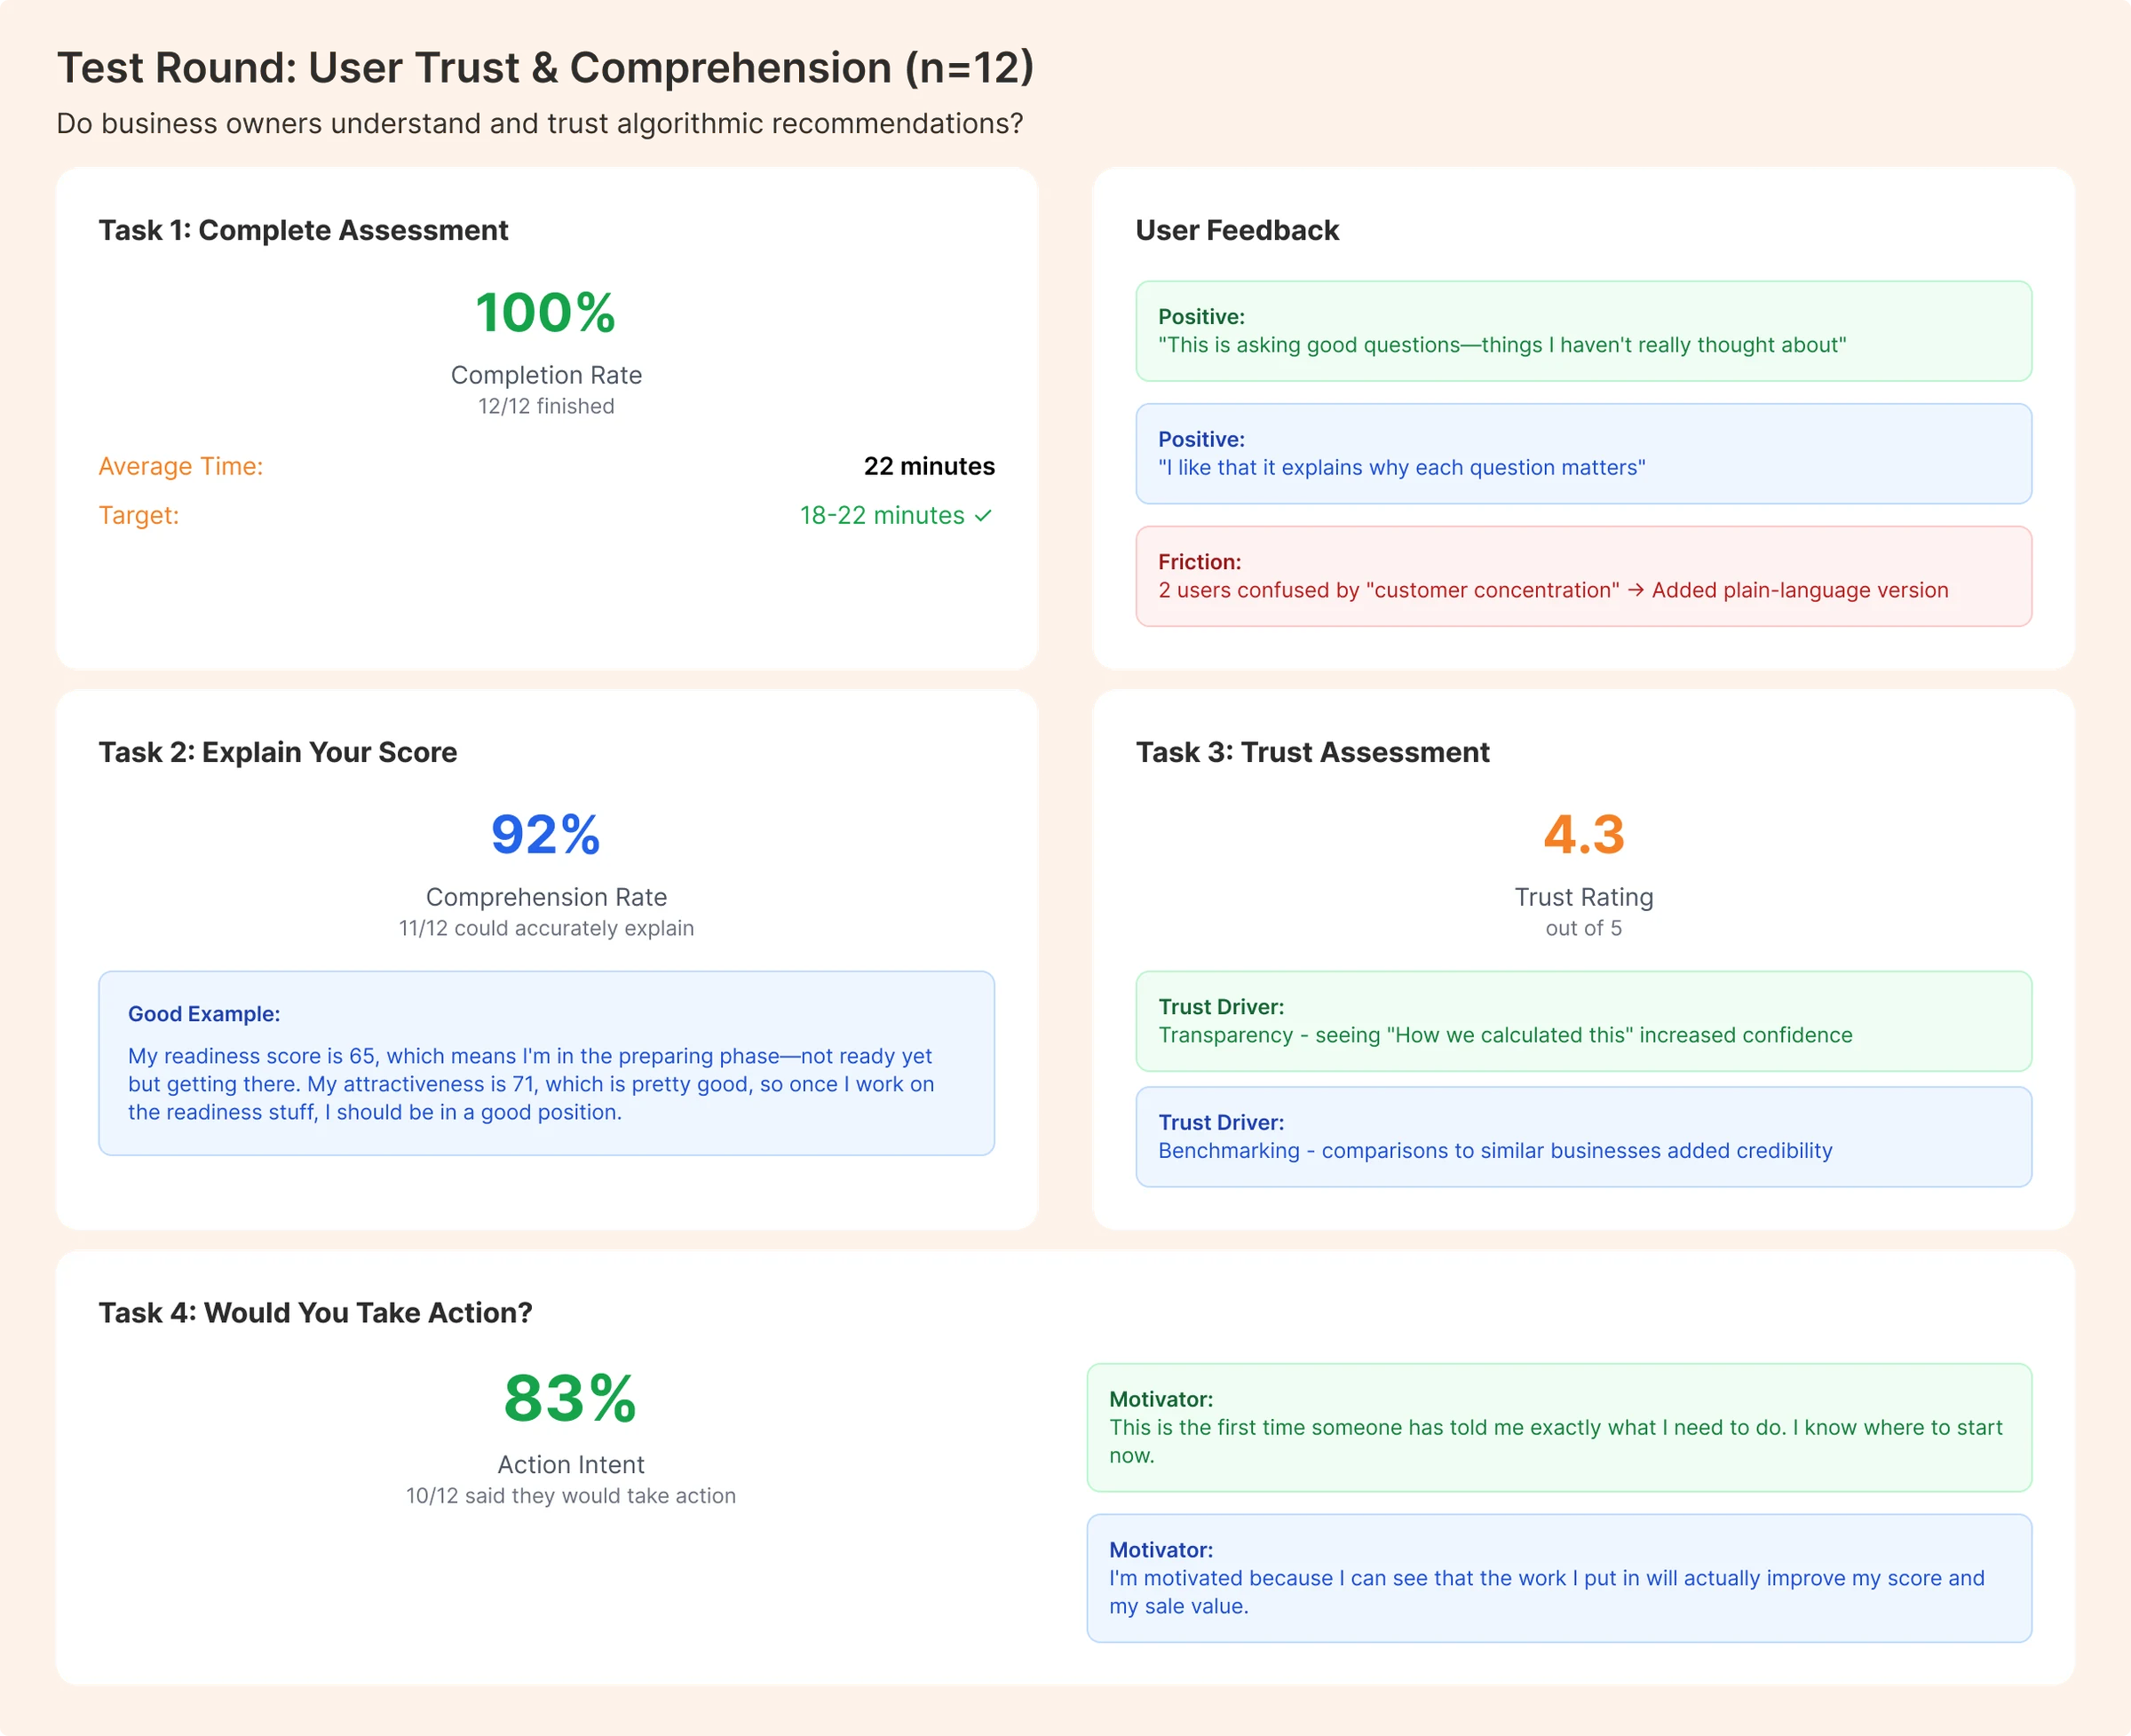
Round 02 · User Trust & Comprehension (n=12)
Do owners understand and trust algorithmic recommendations?
83%
10/12 said they would take action · 92% could accurately explain their score · 4.3/5 trust rating
FRICTION"Customer concentration" confused 2 users — industry jargon without context
FIXRewritten as: "What % of revenue comes from your biggest single client?"
MOTIVATOR"This is the first time someone has told me exactly what I need to do. I know where to start now."
Round 03 · Relationship Manager Usability (n=8)
Can RMs effectively use this tool with clients?
9.1
RM confidence out of 10 · 3x improvement in net client engagement (8% → 25%)
BEFORENet engagement 8% — RMs lacked a concrete offer; guessed which advisor to recommend
AFTERNet engagement 25% — assessment gave RMs something tangible to offer; advisor matching removed the guesswork
QUOTE"Instead of vaguely suggesting succession planning, I can say 'Take this 20-minute assessment.' The advisor matching feature is huge."
06.2Business Impact
Measurable Results at 6 Months
Post-launch data from product analytics, advisor-reported funnel metrics, and validation studies.
Quantitative Impact
Client engagement with succession services35% → 86%
Time to first engagement6.2 wks → 2 wks
Advisor–client mismatch rate67% → 18%
Assessment completion rate85%
Algorithm accuracy (advisor agreement)94% → 98%
NPS score improvement+67 points
Engagement rate improvement236%
Additional annual revenue generated$1.5M
How mismatch was measured: the share of first consultations where the owner met the wrong advisor type or came at the wrong time, as reported by PNC’s succession advisors. 67% at baseline, 18% six months after launch.
Business Owner Feedback
"I finally feel like I'm getting personalized advice that actually applies to my unique situation. The assessment questions are specific and relevant to my business model."
Manufacturing Owner · "The system finally understands my business"
Advisor Feedback
"The system's smart routing has dramatically improved our matching accuracy. We're finally connecting with owners who truly understand our expertise and business needs."
Senior Specialist · "Advisor matching is finally accurate"
Advisor Feedback
"Owners used to arrive with no context. I'd spend 40 minutes asking basic questions just to figure out if they're ready and if I'm the right advisor. Now they come with completed assessments, understand their gaps, and we dive straight into planning."
M&A Advisor · "Saves me an hour of qualification work"
Business Owner Feedback
"Every advisor told me 'delegate more' and 'document your processes.' But HOW? This gave me specific tasks: identify 20 decisions I make, create frameworks for 5 of them, delegate in months 1–2. Checkboxes, timelines, actual steps I can execute."
Construction Firm Owner · "Finally, concrete next steps"
Designed for What Comes Next
The algorithm architecture was built to support ongoing refinement without structural rework — dimension weights, rule thresholds, and persona routing logic are all independently adjustable as new assessment data accumulates. The 11% of cases that fell outside the four core personas were tracked post-launch as the primary signal for future persona expansion. The product was handed off with a documented rule governance framework — a structured spec covering each of the 47 rules, their conditions, scoring impact, and owner — so the advisory team could refine criteria without requiring a design or engineering sprint. Engineering received annotated component specs, interaction states, and edge case handling documentation for all 135+ screens.
06.3Reflection & Learnings
What I'd Do Differently
I'd codify the algorithm before the UI, not in parallel
We ran discovery and algorithm design alongside each other. That created friction — advisors were being asked to validate rules while I was still designing the screens those rules would surface in. The back-and-forth cost us two sprints. Next time I'd lock the full rule logic with advisors before touching a single layout. The algorithm is the product. The UI is just how you see it.
Lessons Learned
The Real Problem Is Often Hidden Beneath the Stated Problem
✕ Stated Problem
"Owners don't engage with succession planning because they lack education"
✓ Actual Problem (discovered through research)
"Owners can't objectively assess readiness, don't know which path fits their situation, and meet with wrong advisors at wrong times"
Transparency Is Non-Negotiable for Algorithmic Trust
When an algorithm makes a high-stakes recommendation, the explanation UI is as important as the output. Owners who could see how their score was calculated trusted it. Owners who just saw a number questioned it. In regulated, financial-services contexts especially — show your work.
What this work proves
The most expensive mistake in a complex engagement is building the wrong thing with precision. Three weeks of discovery on this project redirected six months of build — and protected PNC from shipping a product that would have moved nothing. Validating direction before committing to it, and making a data-backed case for a different path to bank leadership, is due diligence I treat as non-negotiable on any regulated, high-stakes product.