
Reducing Construction Payment Cycles From 35 to 6 Days
$12.5M trapped in a 35-day payment cycle. NPS at −12. Three parties with zero shared visibility. This is what a complete redesign of the draw management system actually looked like.
Construction draws took 35 days to pay out, 47% failed on first submission, and lenders spent 15+ hours reviewing each one across five systems. I designed PNC’s contractor and lender portals around one shared record: a checklist showing only the 6–8 documents a draw needs, a 4-stage status tracker, and a side-by-side review with automated pre-validation. Payment cycles fell to 6 days, first-time success rose from 53% to 92%, and NPS moved from −12 to +16.
Contractors waited 35 days to get paid while their subcontractors demanded payment. Lenders reviewed each draw across five disconnected systems. Property owners had zero visibility. With NPS at −12, $85M in revenue was at risk.
Two products sharing the same data. Contractors get a dynamic checklist, real-time upload validation and a 4-stage status timeline. Lenders get a side-by-side review, automated pre-validation and high-risk draws surfaced first.
Sole product designer, end to end. 40+ interviews, loan officers shadowed, contractors observed on job sites. 25+ screens, 8 core workflows and a 40+ component design system. 1 PM · 6 Engineers · 1 Content Strategist.
6 days payment cycle, from 35
~5 hrs lender review, from 15+
$12.5M capital deployed faster per quarter
45% contractor retention improvement
What Construction Draw Management Is
When a developer or contractor takes a construction loan, they don't receive the full amount upfront. They draw it down in stages — submitting a draw request to prove work has been completed, which triggers a lender review, inspection, and payment approval before funds are released. This process repeats every few weeks throughout a build. It involves three parties: the contractor waiting to get paid, the lender responsible for verifying work and releasing capital, and the property owner who funded the whole thing. When it works, cash flows on time and projects stay on schedule. When it breaks — and it was broken — contractors wait 35 days per cycle, subcontractors don't get paid, projects stall, and lenders hemorrhage review hours on a manual process that was never designed to scale.
A Broken Three-Party System
Draw management broke down because three groups needed different things, thought about the process differently, and none of them could see what the others were doing.
Contractors wait 35 days to get paid while their subcontractors demand payment now. Lenders spend 15+ hours manually reviewing each draw across five disconnected systems. Property owners have zero visibility into how their capital is deployed. With NPS at −12 and $85M in revenue at risk, leadership knew the product had to change — or lose to competitors offering faster alternatives.
Average payment wait
A cash flow crisis. Contractors called support 4–5 DM Sans per draw just to get a status update. 47% of draws failed on first submission.
Manual review per draw
62% of review time was spent locating documents across 5 systems — not actually reviewing them. High-risk draws were buried in chronological queues.
Visibility into progress
"I'm funding a $500K project and I have no idea what's happening." Owners relied entirely on contractors forwarding updates — the weakest link.
My Role
- Sole product designer, end to end: research, both portals, design system, delivery
- Designed both contractor and lender portals across 25+ screens and 8 core workflows
- Ran all discovery including interviews, shadowing, and survey analysis
- Built the design system later adopted across 4 products in the Tech Innovation Group
- Embedded in sprint planning with PM and engineering — wrote acceptance criteria and did design QA every release
The Business Opportunity
- Platform: a custom React web app on top of a proprietary loan management system, so every design decision had to work within the existing APIs
- Differentiate on contractor experience — competitors still used manual processes
- Unlock faster loan originations by reducing the draw cycle bottleneck
- Reduce $85M at-risk revenue by recovering NPS from −12
- Cut operational costs by eliminating preventable support tickets
- Increase contractor retention and referral volume
Discovery
of lender review time was spent locating documents across 5 systems — not actually reviewing them.
Understanding the Root Causes
Before sketching a single screen, I spent 4 weeks inside the problem — interviewing, shadowing, and analyzing 6 months of historical data to find what was actually causing the 35-day cycle.
Stakeholder Alignment
A business process workshop to agree on research scope, success metrics and priorities before we went into the field.
Deep User Research
40+ stakeholder interviews. 3 loan officers shadowed during live draw reviews. 5 contractors observed on active job sites.
Validation & Benchmarking
3 competitive platforms analyzed. 6 months of historical draw data reviewed. 200+ contractor survey responses analyzed for patterns.
User Segmentation & Prioritization
Prioritized by business impact, frequency, and design complexity before committing to scope.
Agreed before design work began. Tracked via Mixpanel event instrumentation + support ticket volume dashboards.
The People Behind the Process
Two primary personas built from 40+ interviews, contextual inquiry, and on-site shadowing. They aren't guesses about age or job title. They're based on what we actually watched people do.


In Their Own Words
The same frustrations kept coming up with all three groups. These aren't summaries. They're what we heard in interview after interview.
"I never know when I'll get paid"
- Waited 35+ days from submission to payment
- Uploaded 12–18 documents with unclear requirements
- Received rejection emails with vague, unhelpful messages
- Called lender support 4–5 DM Sans per draw just for status
"We're drowning in manual review"
- Spent 15+ hours reviewing each draw request manually
- Toggled between 5 different systems to verify one document
- No automated validation of document completeness at all
- Compliance risk from inconsistent review processes
"Where is my money going?"
- Zero visibility into draw request status at any stage
- Couldn't track how loan funds were being deployed
- Relied entirely on contractors to forward any updates
- No mobile access to project financial status at all
Three Findings That Ignited the Solution
After synthesizing 40+ interviews and analyzing 6 months of historical data, three insights emerged that shaped every decision that followed.
"I don't know what you need until you tell me I did it wrong."
— 8 out of 10 contractors expressed this exact frustration
- ✕Hunt through email attachments for requirements
- ✕Interpret legal language without guidance
- ✕Guess at budget category mappings
- ✕Submit and pray they got it right
- ✓Display all requirements upfront before starting
- ✓Use plain language with examples
- ✓Validate inputs before submission
- ✓Guide users toward success
The Mystery Requirements Problem
47% first-time failure rateDraw requests failed on first submission due to missing or incorrect documentation — entirely preventable with better upfront guidance. Contractors were guessing what to submit based on previous rejections, creating a costly trial-and-error loop that delayed payment by weeks.
The Black Hole Status Problem
4.2× average support calls per drawContractors had zero visibility after submission. Radio silence for weeks. The only way to know a request was received — let alone in review — was to call the lender directly. This generated enormous support overhead, eroded trust, and consumed loan officer time that should have been spent reviewing draws.
Lenders Want Assistance, Not Automation
Lenders need automated validation, not automated decisions. They want the system to handle grunt work — checking completeness, validating budgets, flagging anomalies — while preserving full human judgment on final approval. Automating decisions would create compliance and liability exposure that no lender would accept.
Six Months of Data Confirmed the Findings
Historical draw data quantified each pain point and revealed the precise business cost of not fixing them.
Rejection Reasons
Top Support Ticket Reasons
Loan Officer Time Breakdown
Key Insight: 73% of all support tickets were about status visibility (42%) and requirements clarity (31%) — both completely preventable with better UX. That one finding shaped the whole design strategy.
What the Market Was Getting Wrong
I evaluated 3 modern construction lending platforms to identify best practices and map the whitespace for differentiation.
Competitor A
- Strong contractor mobile app
- Clean submission interface
- Weak lender review tools
- No automated pre-validation
- Chronological queue only
Fixed the contractor side and gave lenders nothing. Half the problem solved, then called done.
Competitor B
- Excellent backend automation
- Real-time status updates
- Poor contractor UX — overwhelming
- Automated decisions, not validation
- Compliance risk for lenders
Automated everything including final decisions — creating compliance liability no regulated lender could accept.
Competitor C
- Beautiful, modern UI
- Clean dashboard layout
- Mystery requirements unsolved
- No proactive guidance at all
- Feature-shallow despite polish
Their status tracker exposed 11 internal workflow stages that meant nothing to contractors. We collapsed these into 4 user-meaningful milestones — the core requirements problem still untouched.
The Gap We Owned
No competitor had solved the "mystery requirements" problem. Contractors across all three platforms were still guessing what to submit. This was our biggest and most defensible differentiation opportunity.
The Design Opportunity
Most platforms only cared about lender efficiency and ignored contractors. The real opportunity was designing for both at once, without shortchanging either.
The Strategic Insight
Best-in-class competitors offered real-time status but not proactive guidance. Adding contextual education and "why needed" explanations was entirely uncharted territory in this space.
Define & strategy
possible requirements, filtered to the relevant items for each draw context.
Translating Research Into a Design Challenge
Once research was done and the three insights held up, we needed to agree on one clear problem before exploring solutions. This is where we got on the same page.
Construction contractors and lenders need a way to exchange draw requests with confidence and visibility because unclear requirements and zero status transparency are causing 47% of draws to fail on first submission and costing the business $85M in at-risk revenue.
How Might We…
The three design challenges the team aligned on before any ideation began.
How might we give contractors the exact information they need to submit correctly — before they start, not after they fail?
How might we make draw status visible to all parties without exposing internal lender operations or creating complexity?
How might we help lenders review draws faster without automating decisions that carry compliance and liability risk?
Strategy, Principles & The Central Design Challenge
With the "How Might We" questions defined, this section established the guiding principles that filtered every design decision that followed.
From Reactive to Proactive
The fundamental shift that defined every design decision.
Build one platform that works for two very different ways of thinking, without making either group work the other's way. Contractors think linearly. Lenders think in queues and exceptions.
Contractors → Task-Oriented, Linear
- My Projects
- Submit Draw
- Track Status
Lenders → Queue-Oriented, Exception-Based
- Pending Reviews
- Flagged Items
- Approve · Request Info · Reject
Five Design Principles — The Non-Negotiables
Every decision was filtered through these principles, derived directly from research and agreed with the PM before design began.
The "Guide Rail" Approach
Inspired by bowling alley bumpers — rather than letting users fail and correcting them later, guide them toward success from the start.
- →Display all requirements upfront before contractor starts
- →Use plain language, not legal jargon
- →Show examples of acceptable documents
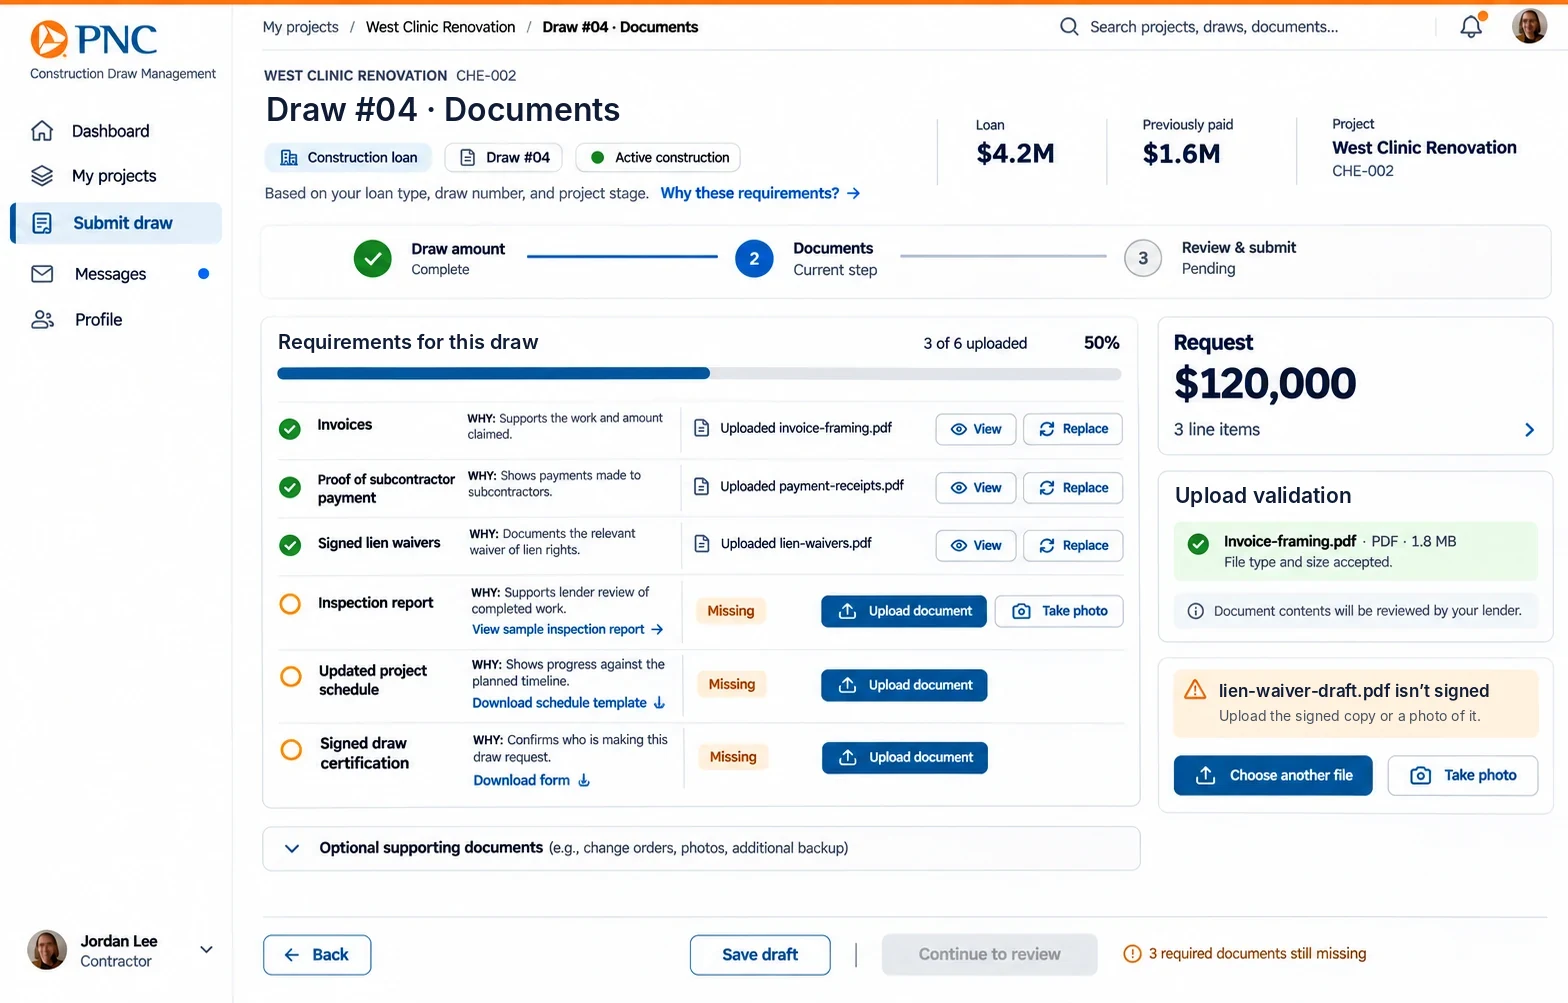
- →Check document file types on upload — before submission
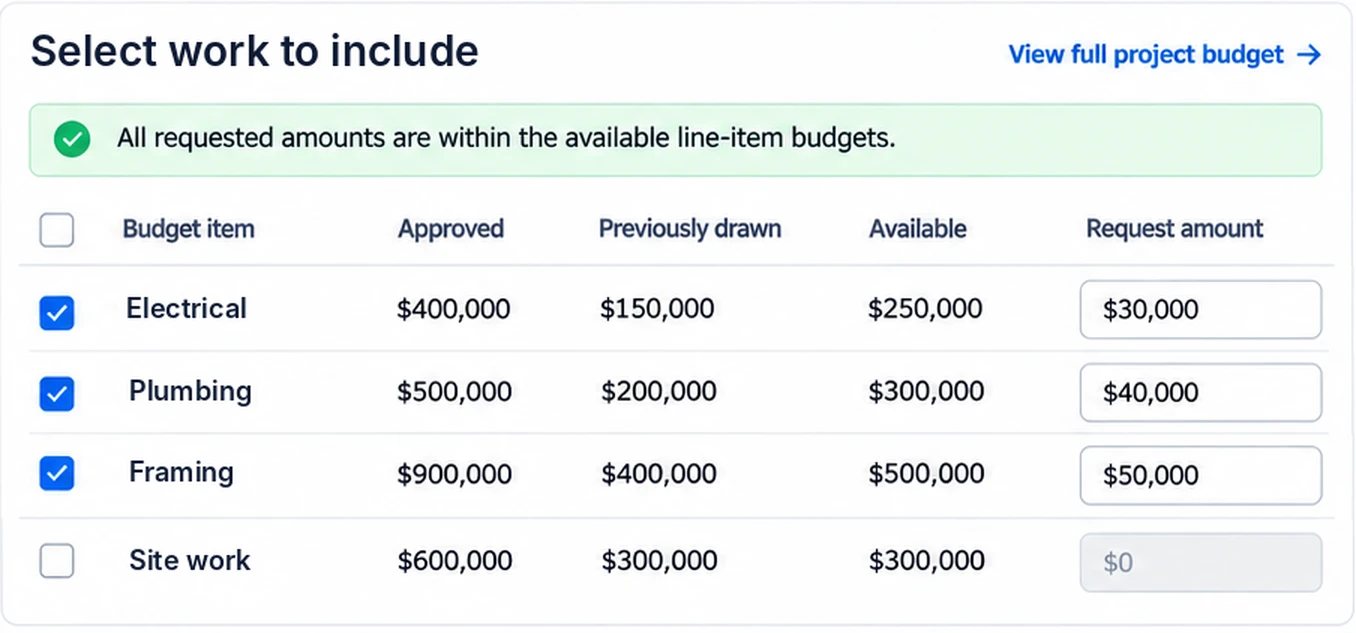
- →Validate budget amounts against contract in real-time
- →Flag missing required fields with specific guidance
- →Pre-fill data from loan contract and previous draws
- →Auto-calculate remaining budget per line item
- →Suggest document types based on draw stage
- →Break complex form into logical steps
- →Allow save-and-resume — contractors work in bursts
- →Progress indicator so users always know where they stand
Three Directions Before One Solution
Before picking a direction, I explored three very different approaches. Each answered the HMW questions in its own way, with its own tradeoffs.
Direction B was presented to the PM, engineering lead, and two senior lenders in a working session at end of Sprint 3. We walked through all three directions, the research evidence behind each decision, and the tradeoffs. The team aligned on Direction B with one modification: the lender portal's review queue would be built as a separate authenticated session from the contractor portal — a compliance requirement the lenders surfaced in that session.
Two Portals. One Unified Platform.
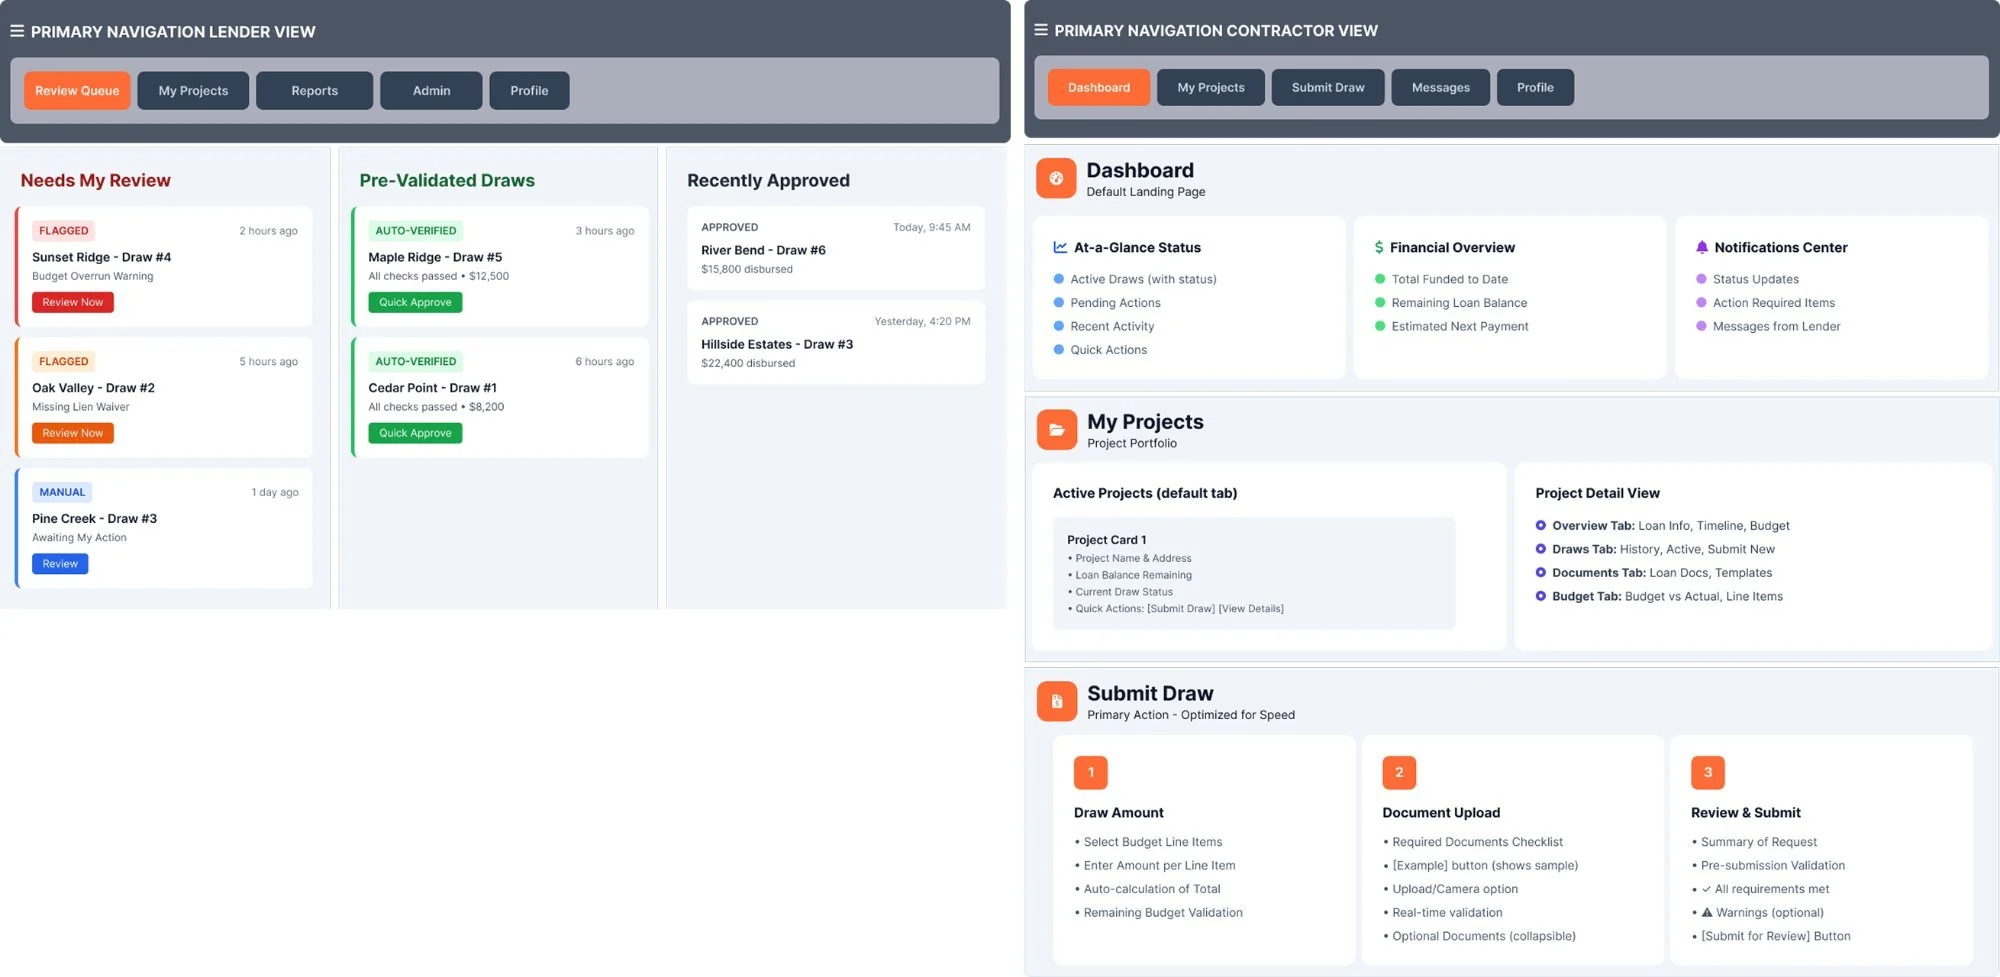
Separate navigation for each user type, each built around how that group thinks, with the same data underneath.
Contractor: First Draw Submission
- Login & DetectionSystem detected no active draws, surfaced prominent CTA
- Guided OnboardingEducational modal explains process before upload begins
- Draw Amount EntryPre-populated budget items with real-time validation
- Document UploadRequired docs surfaced with examples and instant checking
- Review & SubmitSummary with pre-submission checklist — green means go
- ConfirmationSuccess state with tracking number and explicit next steps
Lender: Reviews Flagged Draw
- Review Queue EntryPriority-sorted queue — flagged items always at top
- Detail ViewSide-by-side: review checklist left, document viewer right
- Flag AnalysisBudget overrun highlighted with supporting documentation
- Decision PointThree clear options: Approve, Request Info, or Reject
- Action ModalTemplate-based request for additional info saves time
- Auto-ProgressionNext draw in queue loads automatically — no interruption
IA Design Principles
Five research-driven guidelines applied to both navigation structures throughout the design.
Context-Aware Dashboard
On every login the system works out where the user is and shows the actions they need
Integrated Education
Help content embedded in the flow — not hidden in a separate help section
Progressive Validation
Real-time checks at each step, not just a wall of errors at final submission
Auto-Progression
Next task loads automatically after completion — no dead ends, no manual navigation
Side-by-Side Layout
An action panel that stays on screen, so lenders don't have to keep switching context
Design
context switches per lender review, before the checklist and the documents sat side by side.
Every Decision Had a Why
Six decisions across both portals. Each one has the research behind it, what we built, and what changed.
Six Data-Driven Decisions Across Both Portals
Not everything shipped as designed. Three honest constraints that shaped what launched:
Dynamic checklist shipped in two phases
Engineering estimated the fully contextual filtering at 3 sprints. We shipped a 2-tier version (required vs optional) in Sprint 6, then iterated to full loan-type filtering in Sprint 11.
Property owner portal deprioritized
Research showed highest owner anxiety, but leadership prioritized contractor and lender ROI for Phase 1. I documented the case for a read-only owner dashboard — it shipped in Phase 2.
Real-time status required backend work first
The 4-stage status tracker design was ready in Sprint 4, but required a new event-driven notification system. Design had to hold 3 weeks while engineering built the infrastructure.
The Two Hardest Problems
Two challenges required iterative design exploration before arriving at the right approach.
Contractors guessing which documents to submit. All 45 possible requirements shown upfront — abandonment before the first field.
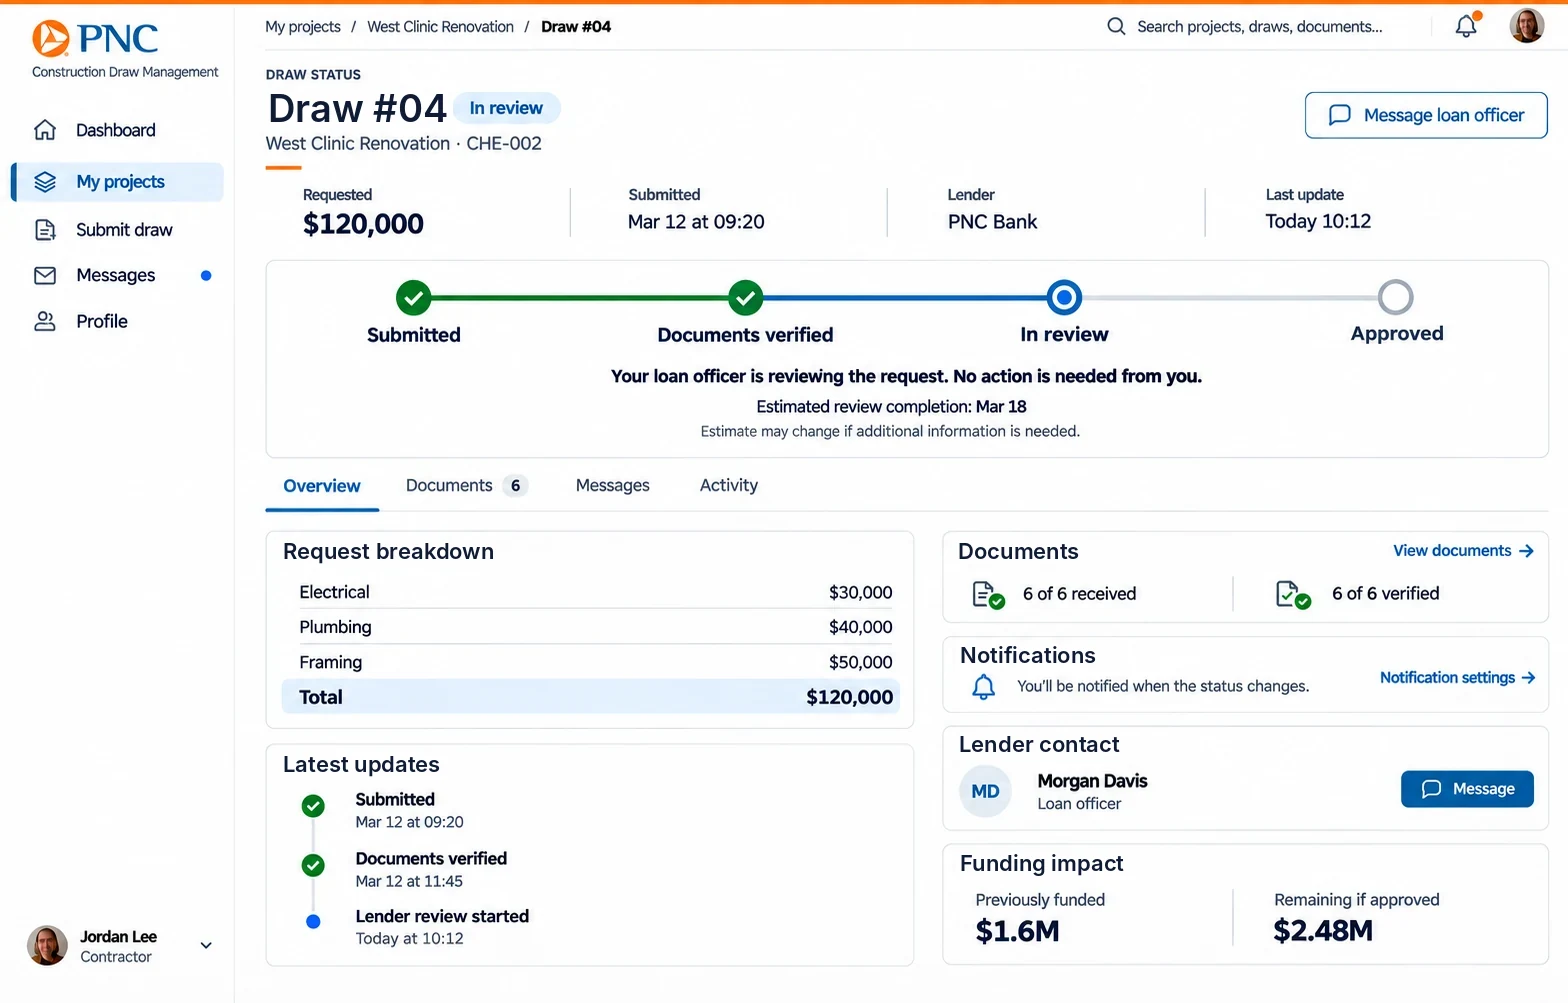
Contractors described submission as "sending requests into a black hole." Binary statuses (Pending / Approved) created anxiety, not confidence.
A 4-stage timeline with an estimated completion window and a short message at each stage. Contractors see where things stand without seeing the lender's internal process.
Built to Scale Across the Tech Innovation Group
With 25+ screens, 3 user types and 6 engineers working at once, we had to have a design system. It was the only way to keep things consistent and keep moving fast.
Five Principles Behind Every Component
These rules shaped every component decision — you'll see them reflected in what follows.
Clarity Over Style
Make it work first. Make it look good second, never the other way around
Progressive Disclosure
Show what's needed when it's needed — never front-load complexity
Accessible by Default
WCAG 2.1 AA built into every component from day one, not retrofitted
Mobile-First
Every component passes the one-thumb test before desktop refinement
Consistent with Purpose
Reuse patterns on purpose. Any one-off needs a good reason
Three-Layer Architecture
Component Decisions — Design Rationale
Real-Time Feedback That Reduces Errors by 35%
Research insight that drove one of the most impactful pattern decisions in the system.
"Please enter a valid email address"
"Password must be at least 8 characters"
"Error"
"Please try again"
Validation fires on blur — not keypress — so users aren't interrupted mid-typing. Every error names the exact problem and tells the user how to fix it. That single decision reduced submission errors by 35%.
Users who received immediate validation feedback completed forms 22% faster and had 35% fewer submission errors.
Non-Intrusive Feedback + Actionable Critical Alerts
Two tiers: passive in-app states for routine events, and action-required alerts for compliance-critical moments.
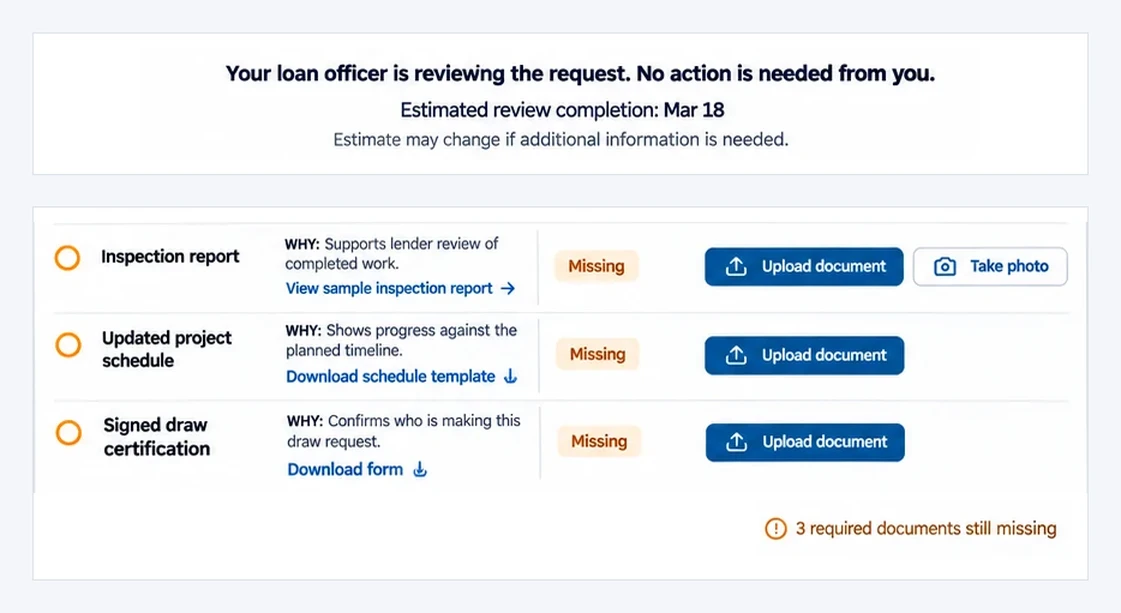
Routine confirmations stay quiet and easy to dismiss. Compliance problems become alerts that need action, listing exactly what's missing, with clear buttons — never generic "please try again" messages that send contractors back to square one.
"Amount must be less than $50,000"
"Please try again"
Two Patterns for Two Different Mental Models
Filling in a multi-step form and checking a status are different jobs, so each got its own pattern.
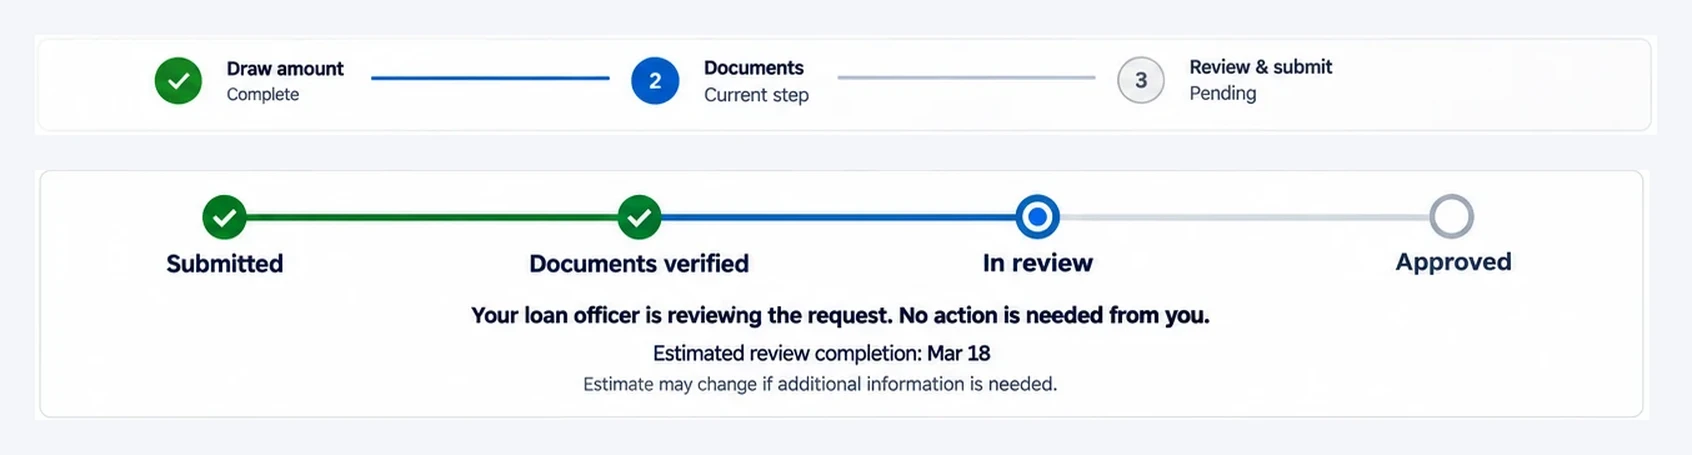
Two fundamentally different jobs demanded two different patterns. Forms needed a numeric progress bar because users wanted to know how much was left. Status needed named stages because contractors needed language they could use when calling their lender.
The 4-stage tracker (Submitted → Documents Verified → In Review → Approved) maps directly to insight #2 — the "black hole status problem." Every stage transition triggers a push notification, eliminating the 4.2× support call pattern.
WCAG 2.1 Level AA — Built In, Not Bolted On
Every component was accessibility-audited before marking it as complete in Figma.
Color Contrast
4.5:1 for text, 3:1 for UI components — verified across all states including hover and focus
VerifiedKeyboard Navigation
Complete tab order logic with visible focus indicators throughout every interaction flow
ImplementedScreen Reader
ARIA labels, semantic HTML, role attributes — tested with NVDA and VoiceOver during development
OptimizedTouch Targets
44×44px minimum on all interactive elements — critical for the 85% of contractors on mobile
CompliantReduced Motion
All animations respect prefers-reduced-motion media query — zero exceptions
ResponsiveText Scaling
Fully functional at 200% text size — no horizontal scrolling, no broken layouts
FlexibleFinal Design Deliverables
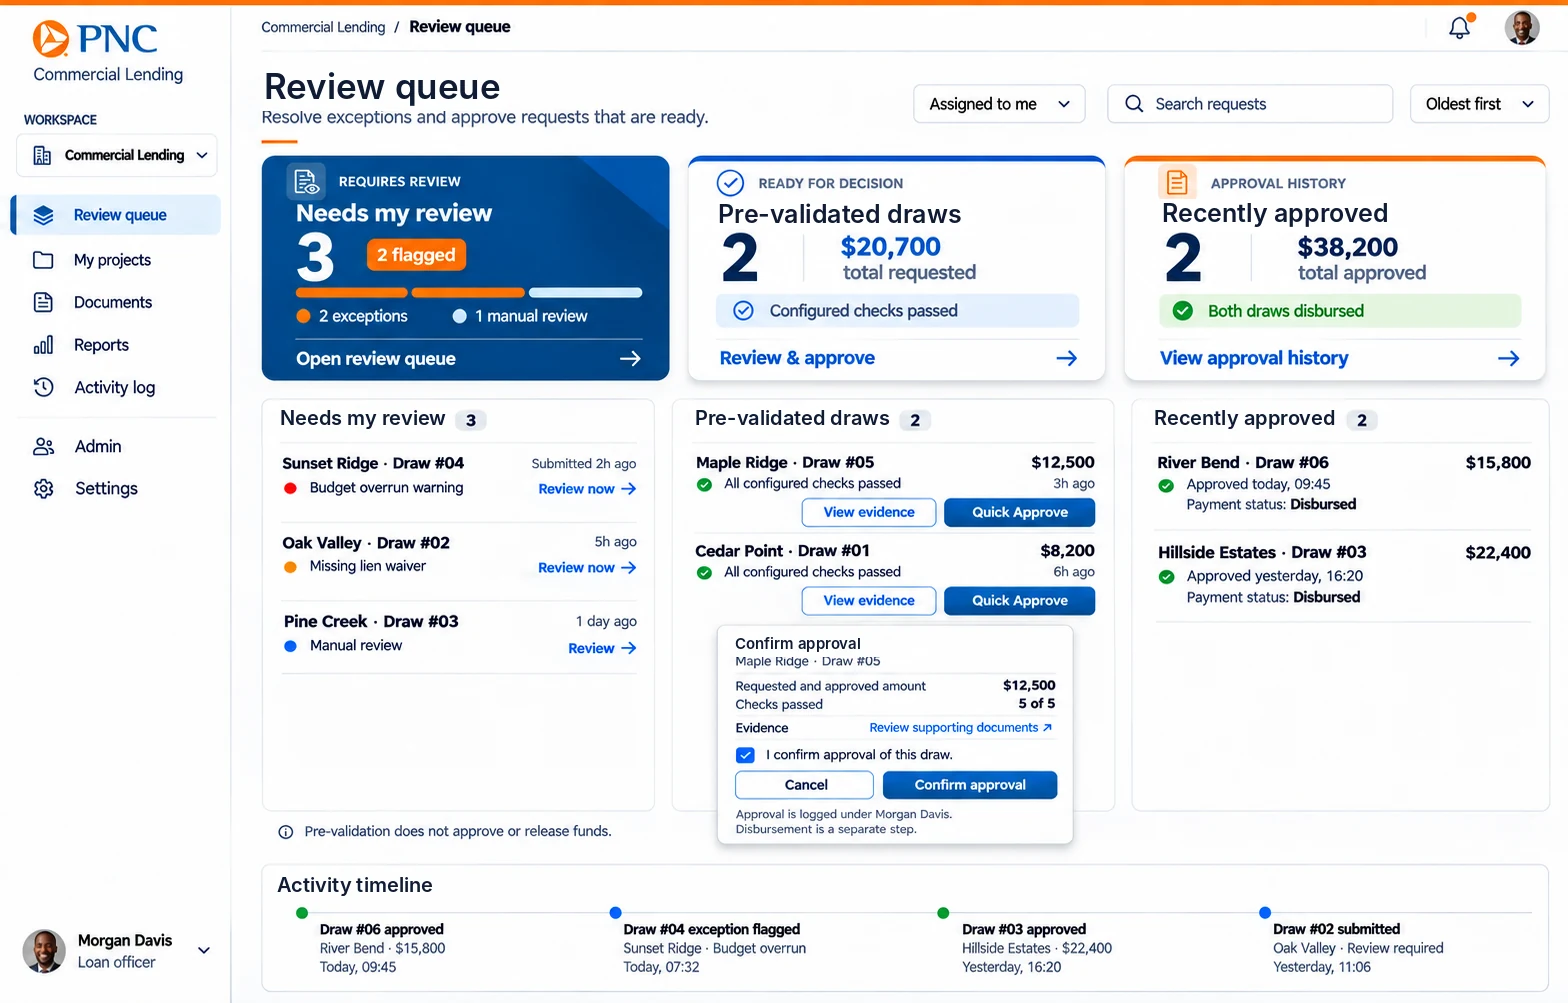
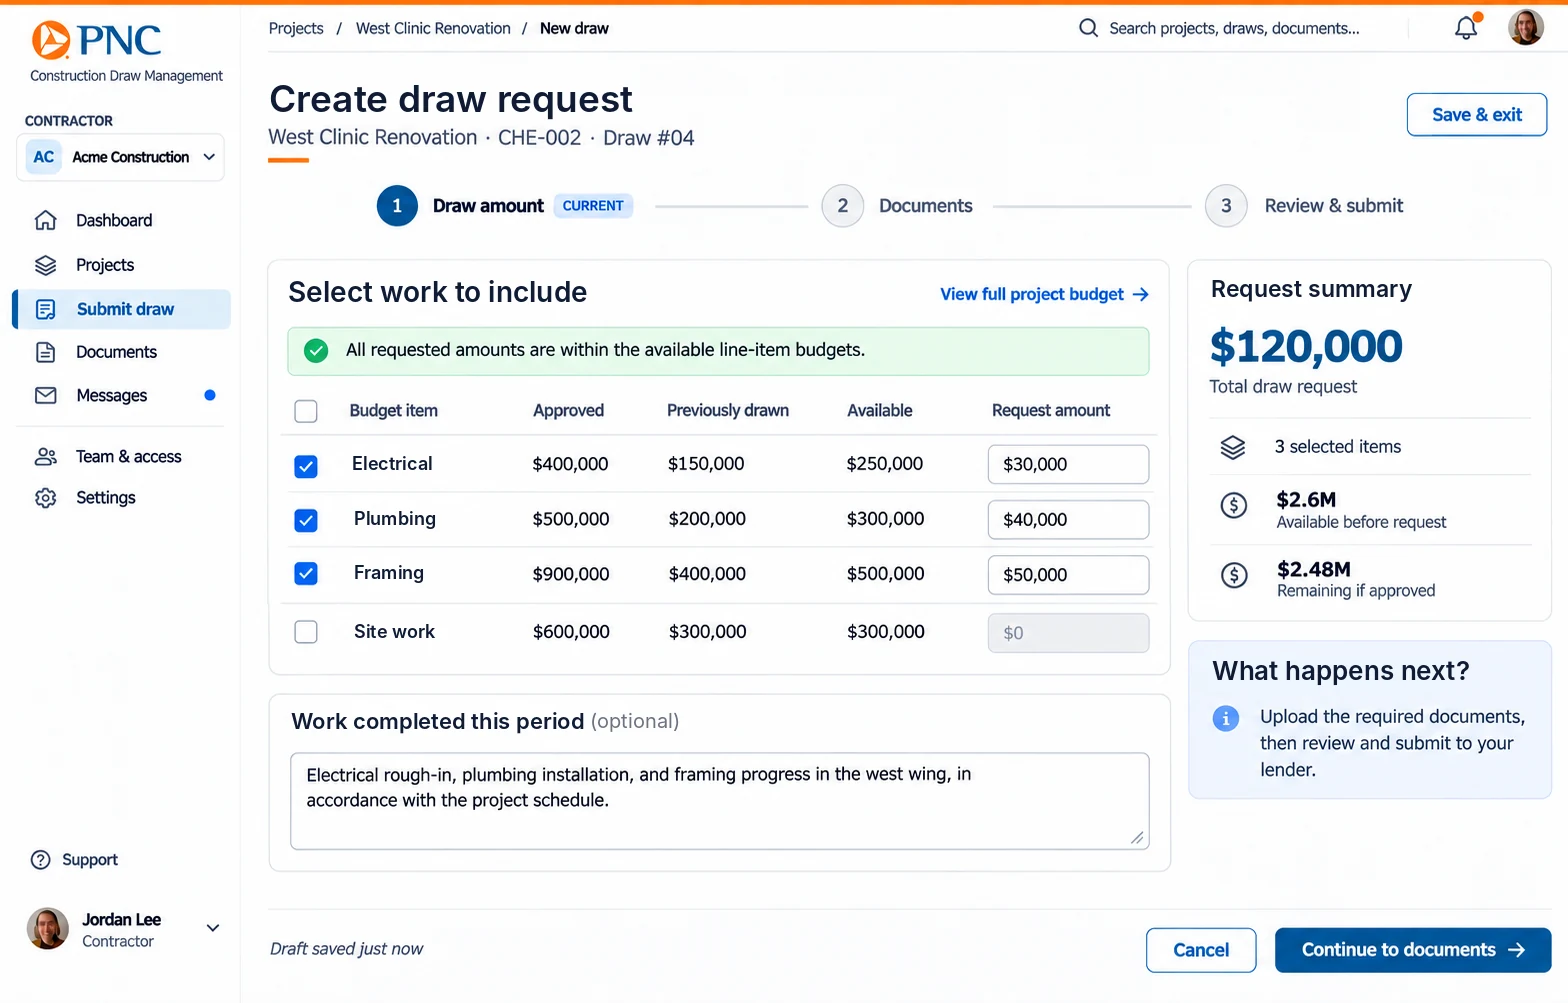
Six key screens across the two portals, reconstructed with sample data. The actual shipped UI is protected under client NDA.
One draw request, two portals
The contractor and the lender work in different products, on the same record.
- Submitted
- Documents verified
- In review
- Approved
Testing & delivery
participants across card sorting, tree testing and prototype testing, before a line shipped.
Three Methods. 52 Participants.
Zero Guesswork.
We tested every structure and interaction decision before it was built. Research confirmed the structure, and prototype testing showed the gaps we still had to close.
Card Sorting
Approach
Gave users 40 cards representing features and content. Asked them to group and label categories without any guidance or prompting from the facilitator.
What We Found
80% agreement on the top-level categories — Dashboard, Projects, Submit Draw. Where people disagreed on sub-categories showed us exactly what to simplify.
Key Outcome
80% Category agreement — confirmed 5-item nav structureTree Testing
Approach
Text-only site structure. Users asked to find specific information — e.g., "Where would you check the status of a draw you submitted last week?"
What We Found
Users struggled to distinguish "Budget" from "Draws" in project details — a critical navigation issue that led to merging budget info directly into draw detail views.
Task Success Rate
87% vs. 80% target threshold — passedAvg. Time to Find Information
8.3s After nav restructure — down from 14.2s baselinePrototype Testing
Approach
Interactive prototype with think-aloud. 5 realistic tasks per user type — contractor and loan officer flows tested separately with actual personas.
What We Found
Contractors loved dashboard quick actions but didn't discover them on their own — confirming the need for a first-login onboarding tooltip sequence.
Direct Success Rate
72% No backtracking — led to onboarding additionWhat Changed As a Result
Added a first-time user guide surfacing both dashboard quick actions and the Submit Draw button on first login — the two features most critical to task success that went undiscovered without guidance.
- 7 top-level navigation items — too many
- Separate Budget and Draws sections — confusing
- Dashboard quick actions hidden below fold
- No first-time user guidance or onboarding
- "Submit Draw" buried 4 levels deep
- 5 streamlined navigation items — confirmed by card sort
- Budget info merged directly into draw detail views
- Quick actions prominently positioned above fold
- First-login tooltip sequence added to onboard users
- "Submit Draw" promoted to primary navigation
The testing insight that changed the most: Contractors consistently rated the dashboard as "really useful" in post-task surveys — but only 28% found the quick actions on their first attempt without prompting. Once people found them, they were clear. The problem was finding them. This single insight drove the addition of a contextual tooltip overlay on first login.
"This is like having a loan officer sitting next to me, telling me exactly what to do. I'd actually use this."
— Contractor with 30 years of experience, Sprint 6 prototype test
That confirmed the vision was resonant. We were solving the right problem.
The Iteration Loop — Test, Change, Retest
Testing wasn't one pass. We went through three rounds of changing the prototype and testing again, and results improved every round.
How We Shipped and What We Watched
Shipped and launched are two different things. Here's how the rollout was structured, what was instrumented, and what we iterated after the first 30 days.
Phased Rollout Strategy
Instead of switching everyone over at once, we launched in three phases to lower the risk and learn before going wider.
Pilot: 50 Contractors
Selected mix of high-volume and first-time users. Legacy system remained active as fallback. Daily monitoring of submission success rates and support ticket volume.
Expand: All Contractors + Lenders
Full lender portal rolled out alongside contractor expansion. Feature flags used to control rollout by loan portfolio. Weekly design QA with engineering to catch anything built differently from the design.
Full Cutover + Legacy Sunset
Legacy system decommissioned. Full 90-day measurement window began. Continued bi-weekly design reviews to address edge cases surfaced from real usage at scale.
What Was Instrumented
- Draw submission start → completion funnel (Mixpanel)
- Step-level abandonment rates across the 4-step form
- Document upload success/failure by document type
- Lender queue interaction patterns (time per draw, skip rate)
- Status tracker open rate — proxy for anxiety reduction
- Support ticket categories and volume (Zendesk integration)
- Session recordings for first-time contractor logins (FullStory)
What We Iterated Post-Launch
- Dashboard tooltip: Returning users kept re-triggering the first-login overlay — limited it to the first two sessions in Sprint 12
- Document naming: Contractors confused by legal document names — added plain-language aliases in Sprint 12
- Lender bulk actions: Loan officers wanted to approve multiple low-risk draws at once — added in Sprint 13
- Mobile upload: Camera upload failing on older iOS — patched Sprint 11, resolved in Sprint 12
- Status ETA: Contractors wanted estimated approval date — added to Phase 2 backlog based on 22% support ticket mentions
Every sprint release included a design QA pass — comparing live implementation against Figma specs across 5 breakpoints. I maintained a running Jira board of implementation discrepancies. 23 issues were filed across the 14-sprint delivery, of which 19 were resolved before the Phase 3 cutover. The 4 remaining were deprioritised with PM sign-off and carried into the Phase 2 backlog.
Impact & reflection
From 35 days to 6, for every draw.
Measured Against What We Set Out to Achieve
Four success metrics agreed with PM and leadership before design work began. Here is how each performed — baseline, target, and actual — across the 90-day window after full launch.
What This Project Taught Me
Four things I took into every engagement after this. Earned, not borrowed.