Microsoft Pulse Case Study
Microsoft · Enterprise Security Platform
Case Study — Ali Syed
Internal Tool · 2022 · 12 Months · 3 Engineering Teams

Solving Slow Incident Response

Engineers were missing SLA targets and nobody had pinned down why. I was brought in to find out — not to redesign anything. What the research uncovered changed the entire scope of the project.

My Role
Sr. Experience Designer
Microsoft Secure
Timeline
12 months
3 eng. teams
Scope
Strategy → Delivery
Platform
Internal Tool
Microsoft
Pulse · Incident workspace
Pulse incident workspace: top-bar incident search, incident timeline with anomaly markers, and recent and suggested DGrep queries 1Search by Incident ID in the top bar 3Suggested DGrep queries, 97% match 4Dashboards, Kusto, DGrep and Actions in one place
2Auto-detected anomaly markers
The Domain
What Microsoft Pulse Is — and Why Incident Response Matters

Microsoft Pulse was the internal tool engineering teams opened when something was actively breaking in production. Service degradation, SLA breaches, security events — Pulse was where on-call engineers went to monitor, diagnose, and fix it. And it was always used under pressure: SLA clocks running, stakeholders in the thread, systems partly down. When the tool was slow or confusing in that moment, it didn't just annoy people. It directly extended resolution time. That's why missed SLA targets here weren't a workflow complaint. They were an operational cost problem. And that's what made this project different from a typical UX engagement from the start.

01
Business Context
Incident resolution was slowing down, SLAs were being missed, and nobody knew why.
01 / The Problem
A business metric problem, not a product request
I wasn't handed a brief that said "fix Pulse." I was brought in because incident resolution was slow, SLAs were being missed, and nobody had the data to say why. That changed how I approached everything.
That difference mattered. My job was to find out what was wrong, not to ship a solution. The product direction came later, once the research told us what was actually broken.
Sr. Experience Designer / Product Owner · Microsoft Secure · Owned research strategy, product direction, backlog, sprint planning, and delivery across 3 engineering teams · 12 months

Microsoft's engineering teams relied on Pulse during their most critical moments — live production incidents, system degradation, SLA-critical failures. Delayed resolution wasn't just a workflow inconvenience. It had real operational cost. Leadership flagged three business-level problems that weren't being addressed:

SLA Risk
Incident resolution DM Sans were increasing
Engineering teams were consistently missing SLA targets on incident resolution. The delays were measurable but the cause wasn't understood. Product teams assumed it was a training or process problem — not a tool problem.
Engineering Velocity
On-call engineers burning cognitive load on tool management
Senior and on-call engineers, the most experienced people in the incident chain, were spending more time finding their way around the tools than actually diagnosing the problem. It cost real time, but nobody could see it.
Executive Visibility
No clear incident lifecycle visibility across escalation chains
Leaders couldn't see where an incident stood. Every time it moved from support to on-call to a senior engineer, the context got lost, and each team worked from its own half of the picture, pieced together differently.
"We know resolution is slow. We don't know if it's the people, the process, or the tools. That's what we need you to find out."
Stakeholder brief — project kickoff
The platform engineers used daily — but wasn't solving the problem
Pulse navigation — Dashboard, Health, Logs, Actions, Manage, Diagnostics, Agent Explorer
Pulse top navigation — 7 categories, each routing to a separate tool built by a different team, with different data models and different ways of organizing the same information. It looked like one product. It wasn't.
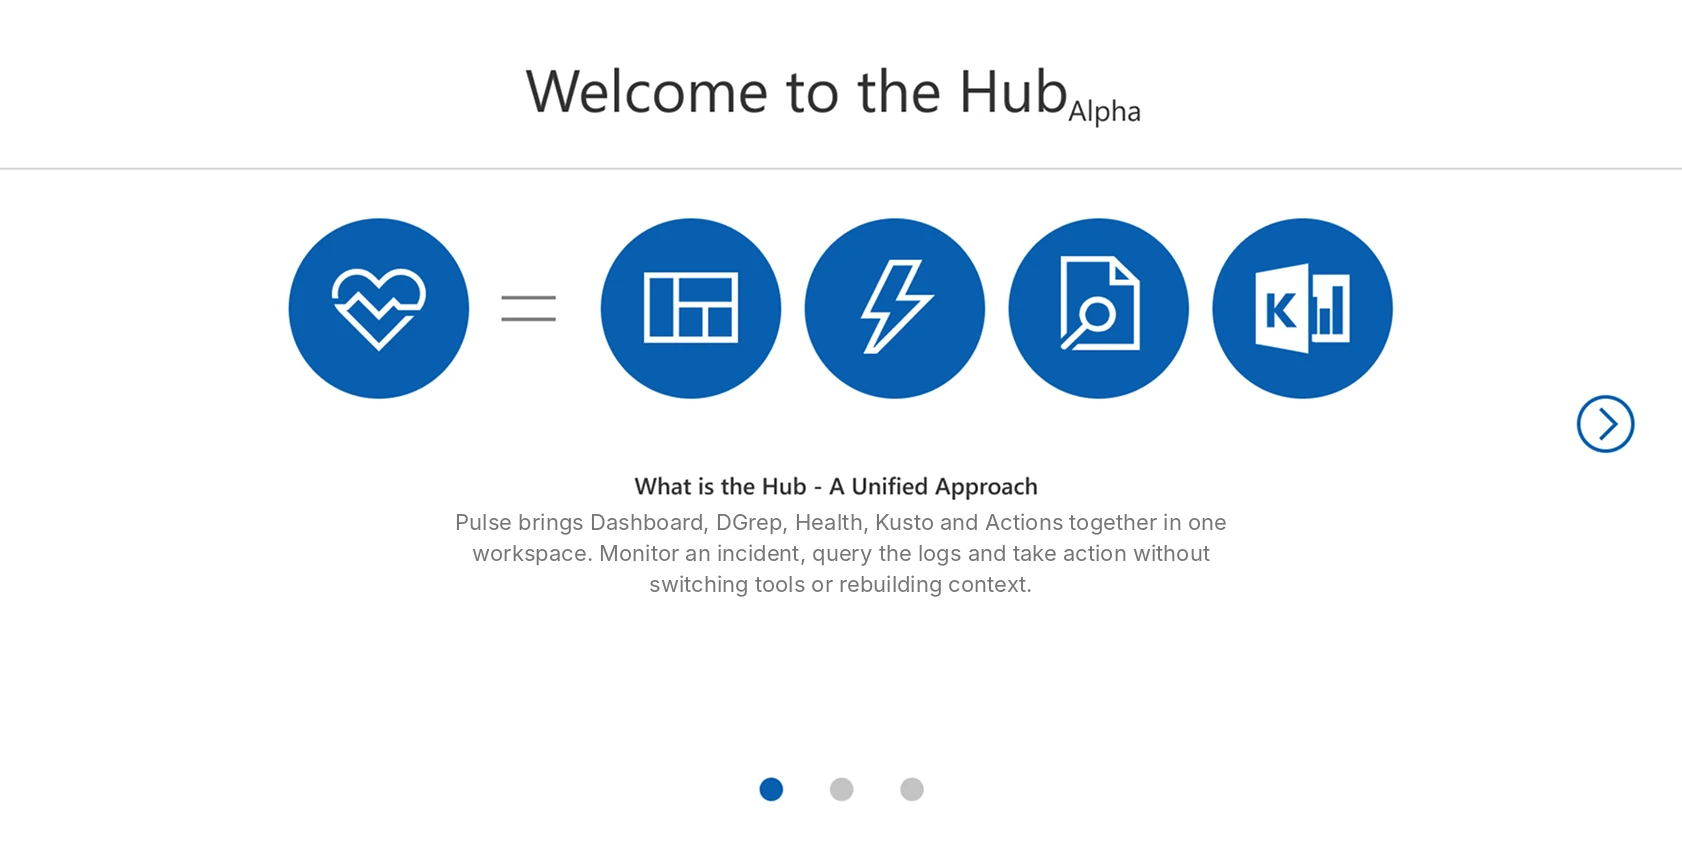
Hub Alpha — the product was sold as unified: Pulse = Dashboard + DGrep + Health + Kusto
Hub Alpha onboarding — the product was positioned as unified: Pulse = Dashboard + DGrep + Health + Kusto + Actions. The vision was correct. The question was: had the execution delivered on it?
02
Research Process
Four research methods, each aimed at one question: why was resolution slow?
02 / Research
Research before solutions
Most projects start with a brief that already hints at the solution. This one started with an honest "we don't know." I structured the investigation to answer one question: why is resolution slow? — not to validate a predetermined direction.
Each method tested one hunch. They all ended up pointing at the same cause, and nobody had named it yet.

I ran four research methods side by side, each testing a different hunch from a different angle. I wasn't hunting for workflow annoyances. I was looking for the real reason a business number was going the wrong way.

01
Contextual Inquiry
Observed engineers during live incidents
Shadowed support and on-call engineers resolving actual incidents — not simulated tasks. Measured where time was actually going. Documented every tool switch, every back-button, every rebuild of a query they'd run before.
→ Generated the 63% finding
02
User Interviews
Structured sessions across all 3 engineer roles
Semi-structured interviews with support, on-call, and senior engineers. Goal: find the friction they'd gotten used to, the things they'd stopped mentioning because they assumed it was just "how the tool works."
→ Surfaced 6 documented failure modes
03
User Journey Mapping
End-to-end incident lifecycle mapping
Mapped the full incident journey across Detection, Assessment, Diagnosis, Action, and Reporting — documenting what tool was used at each stage, what friction appeared, and where context was lost between stages.
→ Exposed handoff failure points
04
Card Sorting
Tested the filter/navigation architecture
Open and closed card sorting sessions with the key user group on how they mentally organize filters and navigation categories. Directly compared engineer mental models to the existing IA structure in the product.
→ Proved IA was built for devs, not users
03
Who We Were Solving For
Support, on-call and senior engineers struggled in different ways. One platform had to work for all three.
03 / User Types
Three personas
Synthesized from contextual inquiry sessions, interviews, and direct observation of support and on-call engineers. This isn't survey data. It came from watching real people fix real incidents under real time pressure.
Jamie David
Support Engineer · 4 years experience · Front-line incident triage
Goal
Resolve incidents faster with fewer steps. Keep stakeholders updated in real time. Never lose momentum mid-incident to tool friction.
Tools Used Daily
Health · Dashboard · DGrep · Kusto · Actions — all separate, all siloed, all requiring context rebuild on entry.
Primary Frustration
Switching between 5+ tools was context-destroying. Every tab-switch was a mental reset mid-incident — at exactly the moment when focus mattered most.
Hidden Pain
Rebuilding the same DGrep queries from scratch every incident. No saved state. No institutional memory. Tribal knowledge lived in heads, not the tool.
"
I need Pulse to be a one-stop solution where I can troubleshoot, update, and communicate without jumping through hoops. Right now I'm spending more time managing the tools than managing the incident.
Jamie David — Support Engineer, contextual inquiry session
Alex Ramirez
On-Call Engineer · 5 years · Primary escalation point
Primary Job
Escalations, deep analysis, corrective actions. On-call at 2am — every second of context rebuild cost real money.
Core Frustration
Lost context every time a log tool opened. Manual handoff notes led to dropped information at every escalation boundary.
"
When I'm on call, every second counts — I can't afford to rebuild context every time I switch into another tool.
Alex Ramirez — On-Call Engineer, contextual inquiry session
Priya Singh
Senior Engineer · 8 years · SLA oversight & strategic diagnostics
Primary Job
Monitor team performance, ensure SLA adherence, champion proactive system improvements. Needed the big picture and the drill-down at the same time.
Core Frustration
Lack of historical context made trend analysis nearly impossible. High-level dashboards required digging through raw logs to get any signal.
"
I need Pulse to give me both the big picture and the drill-down — all in one view. Right now I get neither cleanly.
Priya Singh — Senior Engineer, interview session
04
Research Findings
The root cause was organizational: five tools built by separate teams, presented as one product.
04 / Discovery
What the data said
Every research method pointed to the same root cause: tool fragmentation. Not bad design, not poor training — a structural problem created by years of teams building in isolation.

Two artifacts did the work of convincing stakeholders: the journey map and the synthesized pain points diagram. The journey map showed the problem visually. The pain points numbered it. Together they turned "engineers feel friction" into a documented, evidenced structural failure.

This finding was the pivot of the entire project. It changed the product direction from "improve the surface" to "fix the fragmented architecture that's causing SLA breaches."
Research Artifact 01 — User Journey Map

One incident, five stages: what the on-call engineer went through, and what Pulse changed

AR
Alex RamirezOn-call engineer · 5 years · primary escalation point
GoalQuickly identify, diagnose, and resolve production issues with minimal tool-switching
End-to-end experience goalsMinimize context-switching · Make information glanceable
Before, 2022 baselineAfter launch
01Detection
02Assessment
03Diagnosis
04Action
05Reporting
Doing
Receives an alert via PagerDuty or the internal monitoring system and opens the incident.
Logs into Pulse, checks the system health dashboard and initial logs to judge scope.
Dives into correlated logs, cross-checks metrics and queries services across separate tools.
Executes the fix using pre-defined actions or scripts, then checks whether it held.
Adds notes, tags the incident and submits the RCA or hands off to the next engineer.
Tools
PagerDutyPulse alert section2 tools
HealthDashboardInitial logs3 tools
DGrepKustoDashboard3 tools
ActionsCommand panelSeparate consoles3 tools
Incident timelineNotes panelConfluence3 tools
Thinking
“Is this real, and how bad is it?”
“Which service, which region, since when?”
“I’ve written this query before. Where is it?”
“Did that fix it, or did I just move the problem?”
“Nobody will be able to rebuild what I just saw.”
Feeling
OrientedAlerted
In controlUncertain
FocusedFrustrated
ConfidentTense
DoneDrained
→Support → On-call→On-call → Senior
Pain points

Alert arrives without severity, logs or a health snapshot

Context-switching between the alert and the tools needed to verify it

Workspace reset every session: no saved views, no persistent filters

Filters organized by system module, not by account or datacenter

Three tools with three separate data contexts before diagnosis can start

Identical DGrep queries rebuilt from scratch every incident

Scripts executed in separate consoles; verification needs different views

Slide-in action panel avoided under pressure for fear of losing context

RCA done in Confluence with no direct link to session data

Next engineer starts with zero context from the prior stage

Opportunity
Auto-sync incident details into Pulse with severity, logs and health snapshot.
Persistent workspace and filters organized the way engineers think: Account → Monitor → Dimensions.
Unified query layer with saved templates and visual mapping between systems.
Embedded action triggers with auto-confirmation inside Pulse.
Built-in post-incident reporting with template and session snapshot export.
Finding: Tool-switching was happening at every stage
The journey map showed tool-switching wasn't a pain point at one stage — it was present at Detection, Assessment, Diagnosis, Action, and Reporting. Every stage of the incident lifecycle required engineers to leave the current tool and enter another one with a different mental model.
Finding: Context got lost at every handoff
The Reporting stage revealed a systemic problem: RCA was done in Confluence with no direct link to session data. Every escalation from support → on-call → senior meant rebuilding context from scratch because no tool preserved it across the boundary.
01
Tool Fragmentation — 5 disconnected systems masquerading as one
Health, Dashboard, DGrep, Kusto, and Actions were built by separate teams with separate codebases and no shared data model. Each required engineers to reset their context on entry. The product looked unified from the outside. Inside it was five products with a shared nav bar.
Root cause · Structural
02
Information Architecture — built for developers, not operators
The existing IA organized tools by system module — matching engineering org structure, not how incident responders actually think. Card sorting proved the mismatch directly — engineers expected to navigate by environment (account, datacenter), not by system component.
Proven by card sort · IA
03
Zero Query Memory — knowledge trapped in individual heads
Contextual inquiry documented engineers rebuilding identical DGrep queries at the start of every single incident. No query was ever saved. No institutional knowledge was ever encoded into the tool. When senior engineers left, their diagnostic knowledge went with them.
Observed · Efficiency
04
Navigation overload — 4+ clicks to reach common tasks
Interviews revealed engineers had developed personal workarounds for navigation: bookmarks, browser history, team wikis documenting "how to find X in Pulse." The existence of these workarounds was itself evidence that the navigation was broken.
Interview finding · Navigation
05
No shared visibility across escalation boundaries
Journey mapping revealed that at every escalation boundary — support → on-call → senior — the incoming engineer started with zero context from the prior stage. Incidents were being diagnosed from scratch at every handoff because context had no mechanism to transfer.
Journey map · Collaboration
06
No customization — viewing preferences reset every session
No way to differentiate Active from Inactive plans. No saved views, no persistent filter state. Engineers re-configured their workspace at the start of every incident — setup time that directly ate into SLA-critical resolution windows.
Observed + Interview · Efficiency
63
Observational Finding — Contextual Inquiry
63%
of every incident session was spent navigating tools — not resolving the incident

Engineers weren't slow at diagnosing. They were slow at getting to diagnosing. The 37% of time spent on actual problem-solving was being fragmented by a tool architecture that required constant context-switching. This number changed everything — including the conversation with stakeholders.

Measured via direct observational sessions — shadowing support and on-call engineers across live incidents, DM Sanstamping tool switches, query rebuilds, and navigation events vs. active diagnostic work. Not what people told us, what we watched.

The reframe that changed the project direction: It wasn't the people or the process. It was how the platform was built, and nobody saw it because engineers had gotten used to working around it. Fixing it meant changing the structure, not polishing the screens.
05
Product Strategy
Three directions, the one we built, and what that choice cost.
05 / Strategy
Choosing the scope
When the research landed on fragmentation as root cause, three directions emerged. Each had a different risk profile, different build cost, and a different answer to the question stakeholders were actually asking: how fast can we move the SLA metric?
We picked Direction 3. It wasn't the easiest, but it was the only one that fixed the real problem. Directions 1 and 2 would have shipped faster and quietly failed.

The research gave us a diagnosis. The strategy decision was what to do with it — and that required making a case to three engineering teams and two leadership stakeholders for an approach none of them had asked for.

CUT Direction 1 — Reskin the existing five tools

Unify the surface across Dashboard, DGrep, Health, Kusto, and Actions without touching the underlying architecture. Fastest to ship — 2 sprints. Reason cut: The 63% finding was an architectural problem, not a surface one. Rebranding five fragmented tools would have looked like progress while the actual cause of SLA breaches stayed intact. This direction would have shipped, measured nothing, and required a second engagement 18 months later.

DEFERRED Direction 2 — Integrate the two highest-friction tool pairs

Connect DGrep and Dashboard — the most-switched pair — with context persistence between them. Mid-cost build. Partial impact. Reason deferred: The lifecycle map showed tool-switching at every stage — not just between two tools. A two-tool fix would have covered roughly 30% of the friction, and told engineers we hadn't really understood how big the problem was.

BUILT Direction 3 — Unified investigation platform with persistent context

Rebuild Pulse as a single surface where monitoring, querying, and action happen without tool-switching. Filter architecture rebuilt from card sort findings. Query memory built in. Context preserved across escalation handoffs. Longest build — full 12 months. Reason chosen: The only direction that addressed the root cause. The 63% finding gave us the business case. The card sort gave us the architecture. The nav speed study gave us the layout. Every big decision had data behind it, which made it easy to defend in front of stakeholders.

"Why can't we just make the current tools look more consistent? That's faster."
Engineering lead pushback — strategy alignment session, Month 2

The answer was the 63% number. It wasn't my preference or a design opinion. It was what we watched happen: the way the platform was built was causing the delay. Once that was in the room, the conversation shifted from "should we do this" to "how do we sequence it."

How might weProblem statement

How might we give on-call engineers a single investigation surface — so the 63% of time lost to tool-switching becomes zero, and the platform architecture stops being the source of every delay?”

The Product Direction

Pulse was rebuilt from five disconnected tools into a single investigation platform — where monitoring, querying, and action happened in one surface, with context preserved across every stage of the incident lifecycle.

From Research to Direction — The Strategic Reframe

Once the root cause was named — fragmentation, not bad tooling — the product direction became clear. The goal wasn't to fix five tools. It was to eliminate the reason engineers needed five tools.

— Behaviors We Eliminated
✓ Behaviors We Drove
Excessive Tab-Switching
Navigating between 5+ tools to access basic diagnostic data during a live incident. Every switch broke focus and reset context.
Zero-Switch Resolution
All tools accessible from one surface. Engineers diagnose, query, and act without leaving the workspace.
Rebuilding From Scratch
Engineers rebuilt identical DGrep queries at the start of every incident. No query memory. No institutional knowledge in the tool.
Institutional Memory in the Surface
Recent + suggested queries surfaced automatically. Knowledge accumulated over years lived in the tool, not individual heads.
Context Lost at Every Handoff
Every escalation from support → on-call → senior required rebuilding incident context from scratch. No tool preserved it.
Persistent Context Across Handoffs
Shareable DM Sanstamps, saved filter state, and in-context documentation meant handoffs transferred knowledge, not just alerts.
Reactive Problem-Solving
Engineers responding after degradation was severe — because monitoring was scattered and anomaly detection was manual.
Proactive Monitoring
Continuous system health with auto-detected anomalies surfaced at triage — shifting the workflow from reactive to preventative.
Part 01
Research & Discovery
Business problem identified · 4 investigation methods · 63% finding · Root cause named · Product direction set
→
Part 02
Delivery
Platform architecture · Prioritization · Backlog · Sprint delivery · Outcomes
06
Architecture Decisions
The card sort showed the IA was wrong; the navigation study showed what should replace it.
06 / IA & Navigation
Two studies, two architecture decisions
The card sort didn't just shape the new structure. It showed the old one was wrong. The nav speed study then told us the best structure to replace it with. Both decisions were locked before any feature work started.
Structure first, features second. That order is the difference between a direction backed by evidence and one built on guesses.

The card sort showed a basic mismatch: Pulse was organized around engineering system modules — the way developers structured their internal work. Engineers responding to incidents organized their world around environments and accounts.

Card Sort Results — Filter Architecture
n=12 engineers · Open + Closed sort · 2 rounds
Before — How Pulse Organized Filters
By system module
DGrep Filters · Kusto Filters · Health Filters · Actions Panel
By component type
Scoping Conditions · Filtering Conditions · Namespace · Endpoint
By engineering team
Organization matched internal dev team structure — invisible to incident responders
After — How Engineers Actually Think
By environment anchor
Account (GenevaAccount0204) → Monitor → Dimensions
By datacenter / region
BackendDatacenter · requestType · Namespace as drill-down from environment
By incident context
Time Range, Scoping, and Events were sub-filters of the account/monitor context — not top-level categories
Card sort finding: 11 of 12 engineers grouped filters by environment anchor (account/datacenter) first — not by system module. The existing architecture matched 0 of 12 mental models. This directly restructured the entire platform filter architecture before any feature work started.
Navigation Research — Determining the Three-Level Layout
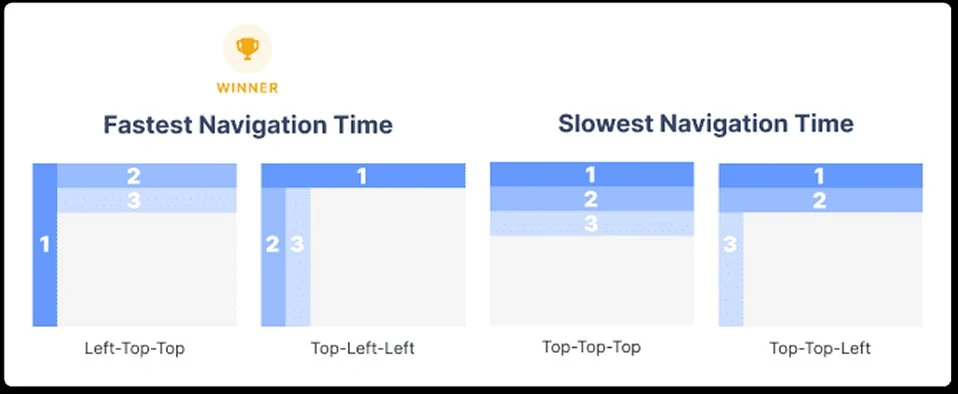
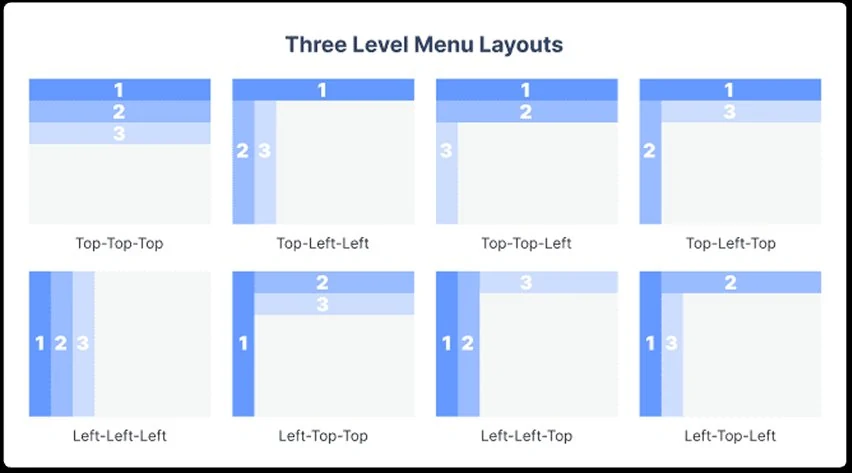
8 three-level navigation layout patterns compared
8 three-level navigation patterns evaluated — Top-Top-Top through Left-Top-Left. Each pattern tested for task completion speed and navigation accuracy with the Pulse user group.
Speed study results — Top-Left-Left wins fastest navigation time
Speed study result: Top-Left-Left wins fastest navigation time. Left-Top-Top was runner-up. The slowest patterns were all Top-Top-Top variants — the model closest to what Pulse originally had.
Architecture decision — locked before wireframing
Top-Left-Left layout became the architectural standard for all three Pulse surfaces. This was a cross-team decision — it required Engineering, DesignOps, and the Platform team to align on a new nav pattern before any feature work started. The speed study data made the alignment meeting 20 minutes instead of 2 hours.
Stakeholder Alignment — Getting 3 Engineering Teams to Change the Architecture

The hardest part of this project wasn't the design. It was convincing three engineering teams — each with their own roadmap, their own tech debt, and their own opinion about what Pulse needed — to agree on a direction that required them to change things they hadn't planned to change.
01
The IA team — convinced by card sort, not by opinion
The team that owned the filter architecture had built it deliberately — organized by system module because that matched their internal taxonomy. Telling them their IA was wrong would have created resistance. Showing them that 11 of 12 engineers couldn't map their mental model to the existing structure made it a data conversation, not a design preference conversation. They requested the raw card sort data. We gave it to them. They changed the architecture.
02
The DGrep team — convinced by the 63% finding
DGrep was built as a standalone product. Integrating it into the unified surface meant the DGrep team accepting that their navigation, state management, and data model needed to be adapted for context persistence — work they hadn't scoped. The 63% observational finding — specifically that DGrep was the most-switched-to tool in every incident session — made their tool the one worth integrating first. They came on board once they saw the problem wasn't how good DGrep was. It was that DGrep stood alone.
03
Leadership — convinced by connecting tool problems to dollar cost
The 63% finding was a UX metric until I translated it. Senior engineers cost approximately $180–220/hr fully loaded at Microsoft scale. If 63% of every incident session was navigation overhead, and the average incident session was 45 minutes, that was 28 minutes of senior engineering time per incident that produced zero diagnostic value. Multiplied across incident volume, the number was large enough that leadership stopped asking if we should fix the architecture and started asking when it would be done.
Architectural decision validated by data: Top-Left-Left hybrid navigation
Horizontal top bar for broad categories + vertical left sidebar for tool depth + contextual panels. We didn't pick it for looks. It tested fastest for three-level navigation. This became the governing architecture for the entire platform.
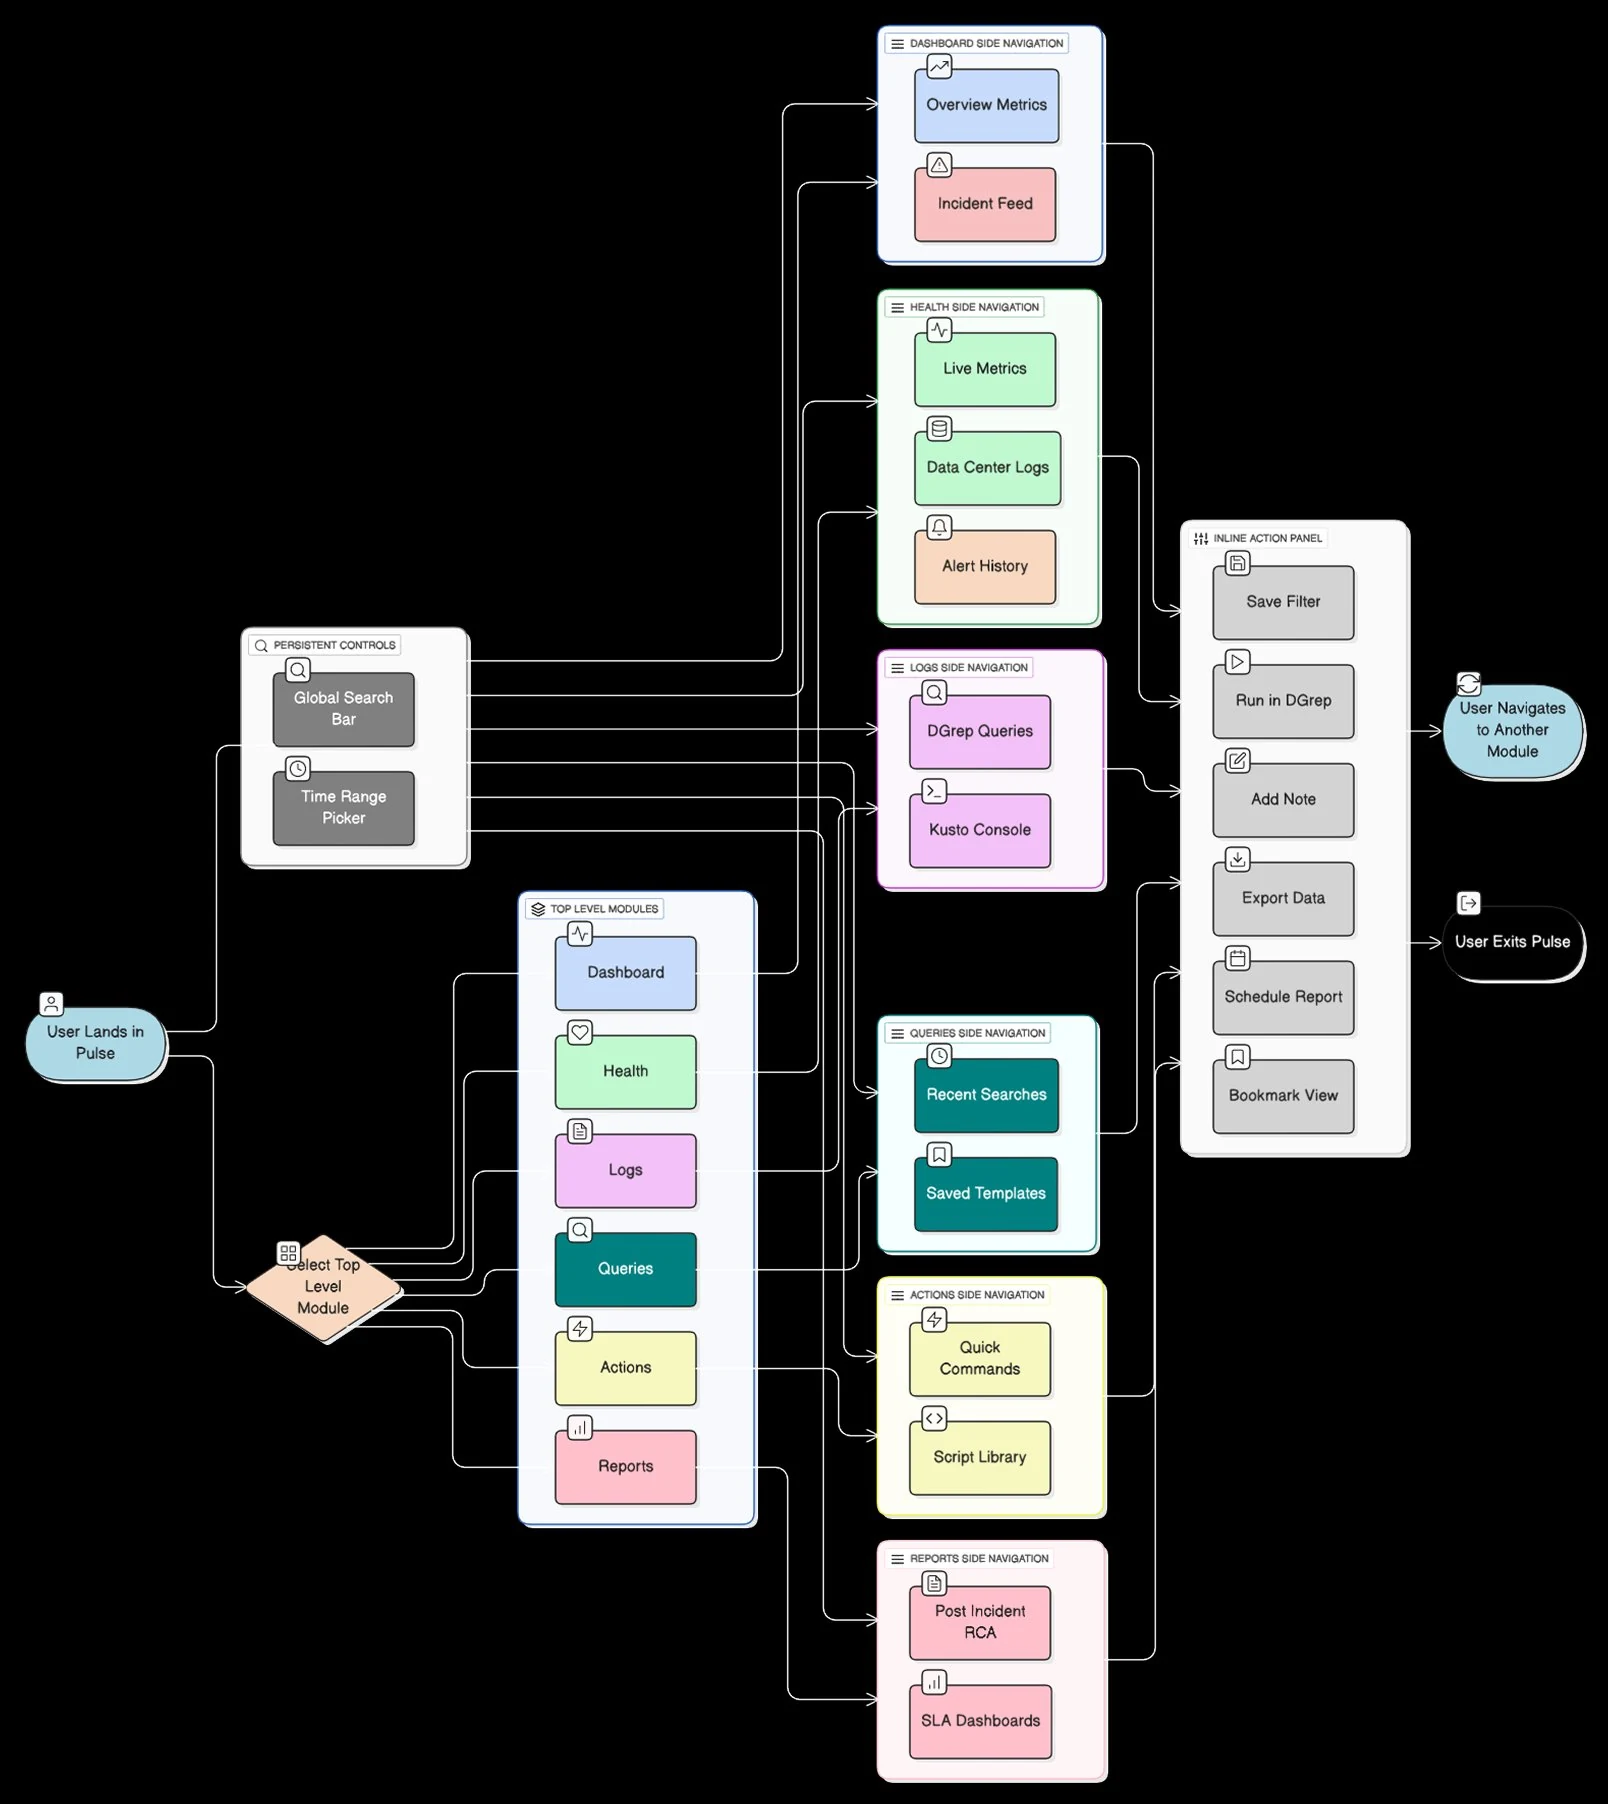
Design Artifact — Future State Interaction Wireflow Pre-Build · Solutioning Phase
Pulse Future State — Full IA and Interaction Wireflow
Structural Fix 01
Persistent Controls

Global Search + Time Range persisted across all modules. Set once, never reset. Directly resolved Finding 06: workspace reset every session.

Structural Fix 02
One Entry Point, Six Modules

Dashboard, Health, Logs, Queries, Actions, Reports — one nav system. Eliminated the mental model reset costing engineers 63% of session time.

Structural Fix 03
Inline Action Panel

Save Filter, Run in DGrep, Add Note, Export, Bookmark — one surface, every module. Replaced 4+ click workarounds engineers had built to navigate the old system.

Task flow: one incident, end to end

How an incident moved through the unified Pulse, from alert to closed RCA

Start / endEngineer actionPulse respondsDecision4Step · loop back to step
Detect Assess Diagnose Diagnose Act Close Part 1 of 2Part 2 of 2 Yes No No Yes Yes No Yes No · re-check results Yes Yes No 5 Refine filters · back to step 5 4 Continues in the unified workspace · step 4 Alert fires PagerDuty / monitor 1 Search by Incident ID 2 First login? 3 Coachmark intro 3 slides · one platform Unified workspace Health · Dashboard 4 Set scope Account → Monitor 5 Anomaly marker? 6 Change time range 1h · 6h · 24h · UTC Jump to marker Eval vs Source metrics 7 Open Logs / Query IIS · DC · Audit 8 Saved query fits? 9 Run saved DGrep 97% · 95% · 92% match Ad-hoc MQL / KQL then Save query Results Logs · Chart · Aggregates 10 Root cause found? 11 Quick Actions fix in context 12 Fix holds on timeline? 13 Needs escalation? 14 Share DM Sanstamp + saved filter state Senior opens same view, no rebuild RCA note in context export session snapshot 15 Incident closed MTTR logged 16

The wireflow above defines the structure; this traces one incident through it. Read left to right, then continue on the second row. Every loop stays inside one workspace: changing the time range, refining scope, re-checking a fix and escalating all return to the same view, with filters and time range intact.
07
Key Design Decisions
Four design decisions, each traced to a research finding.
Design Decision 01
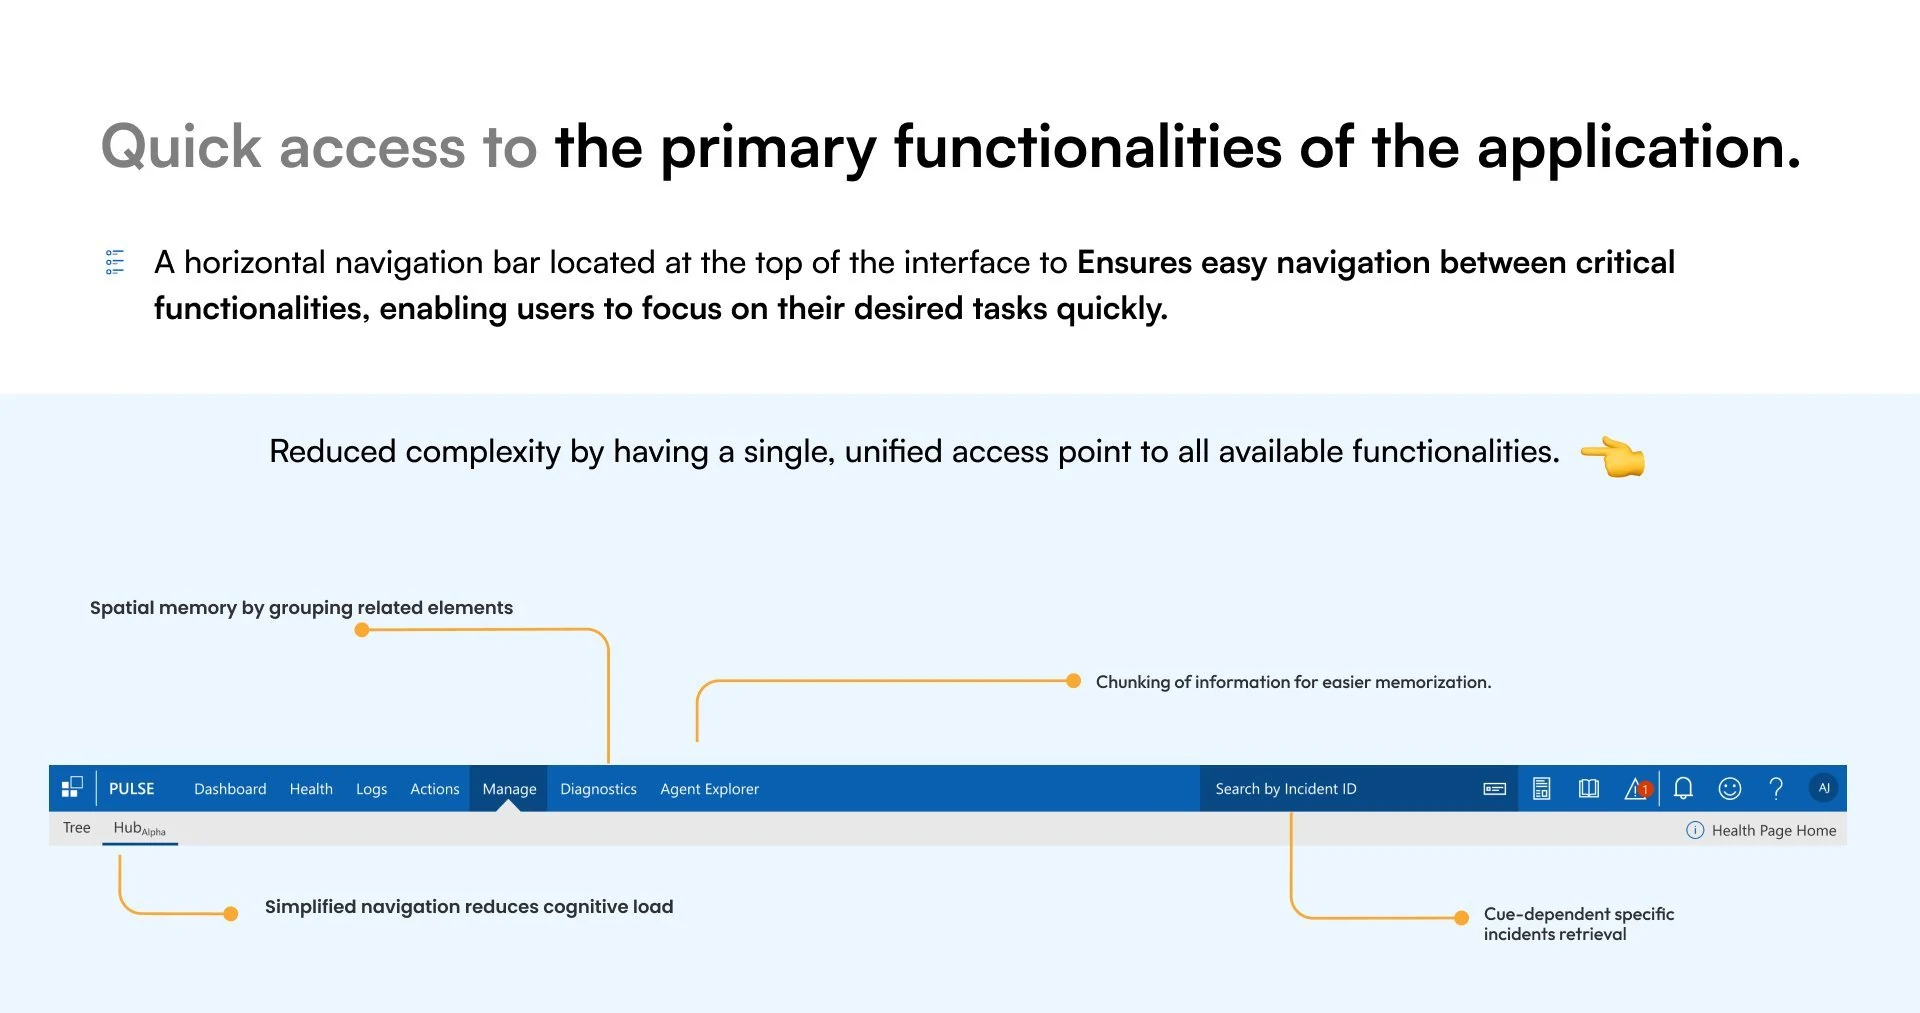
Quick Access to Primary Functionalities

The unorganized top-level navigation forced engineers to scan through dense menus and rely on memory to locate tools during live incidents. A single horizontal bar with grouped categories took that mental load away — spatial memory by grouping related elements reduced the need to search and remember.

Spatial memory — grouping related elements (Dashboard · Health · Logs) meant engineers built location memory after first use. No scanning on repeat visits.
Chunking — information grouped into small, easy chunks, so engineers had less to hold in their heads at the most stressful moments of an incident.
Simplified nav reduced cognitive load — one way in to everything. Search by Incident ID meant engineers didn't need to navigate at all when they already knew the incident.
Quick access to the primary functionalities: the top navigation bar annotated for spatial memory, chunking, simplified navigation and incident retrieval
Design Decision 02
Environment-Anchor Filter Architecture

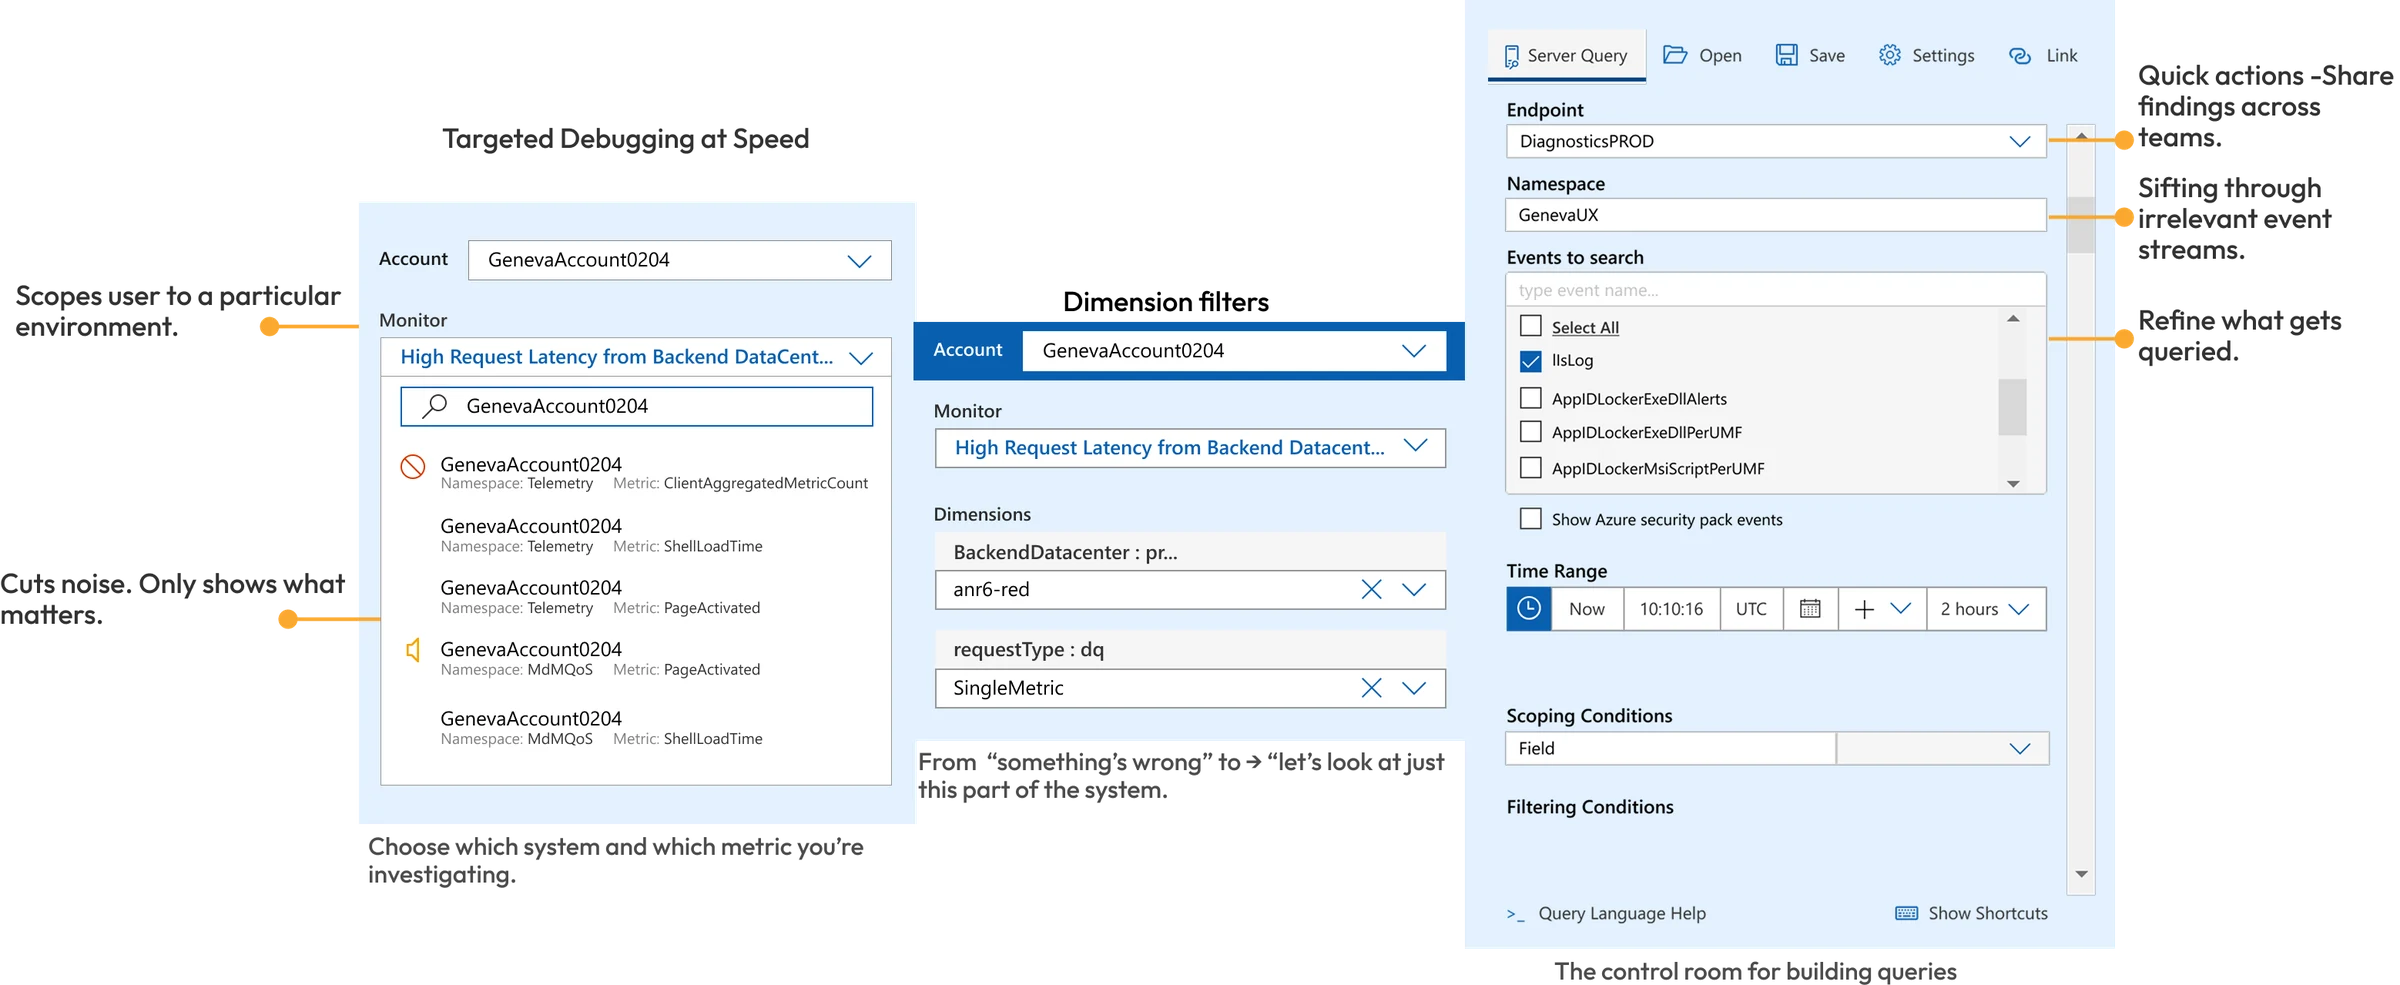
The card sort didn't just tweak the filter order. It replaced it. Engineers thought Account → Monitor → Dimensions, not by system module. These two artifacts show what that looked like on screen: the hierarchy in the dropdown and the continuous filter-to-action loop that replaced 5 separate tool panels.

Environment-Anchor Filter Flow
Account → Monitor → Dimensions dropdown flow annotated
Card sort finding on screen: Account → Monitor → Dimensions hierarchy in practice. Engineers scoped to GenevaAccount0204, selected monitor by namespace/metric, applied dimension filters — left to right, no tool switching.
Filter → Action Loop Architecture
Apply Filter ⊞ FILTERS ⏱ Time Range Namespace Endpoint Severity Level Event Type Scoping Condition Monitoring Region Metric Type Source vs Evaluation Metrics Perform Action ⚡ ACTIONS Run Query Save Query Link Query Configure Dashboard View Logs Export Chart Aggregate View Switch to Chart Mode ↺ Repeat or Finish? ✓ End
Apply Filter → Perform Action → Repeat or Finish. All filters fed into actions (Run Query, Save, Configure Dashboard, View Logs, Export, Aggregate). One continuous loop, zero tool switches.
Design Decision 03
Event Viewer / Metric Timeline

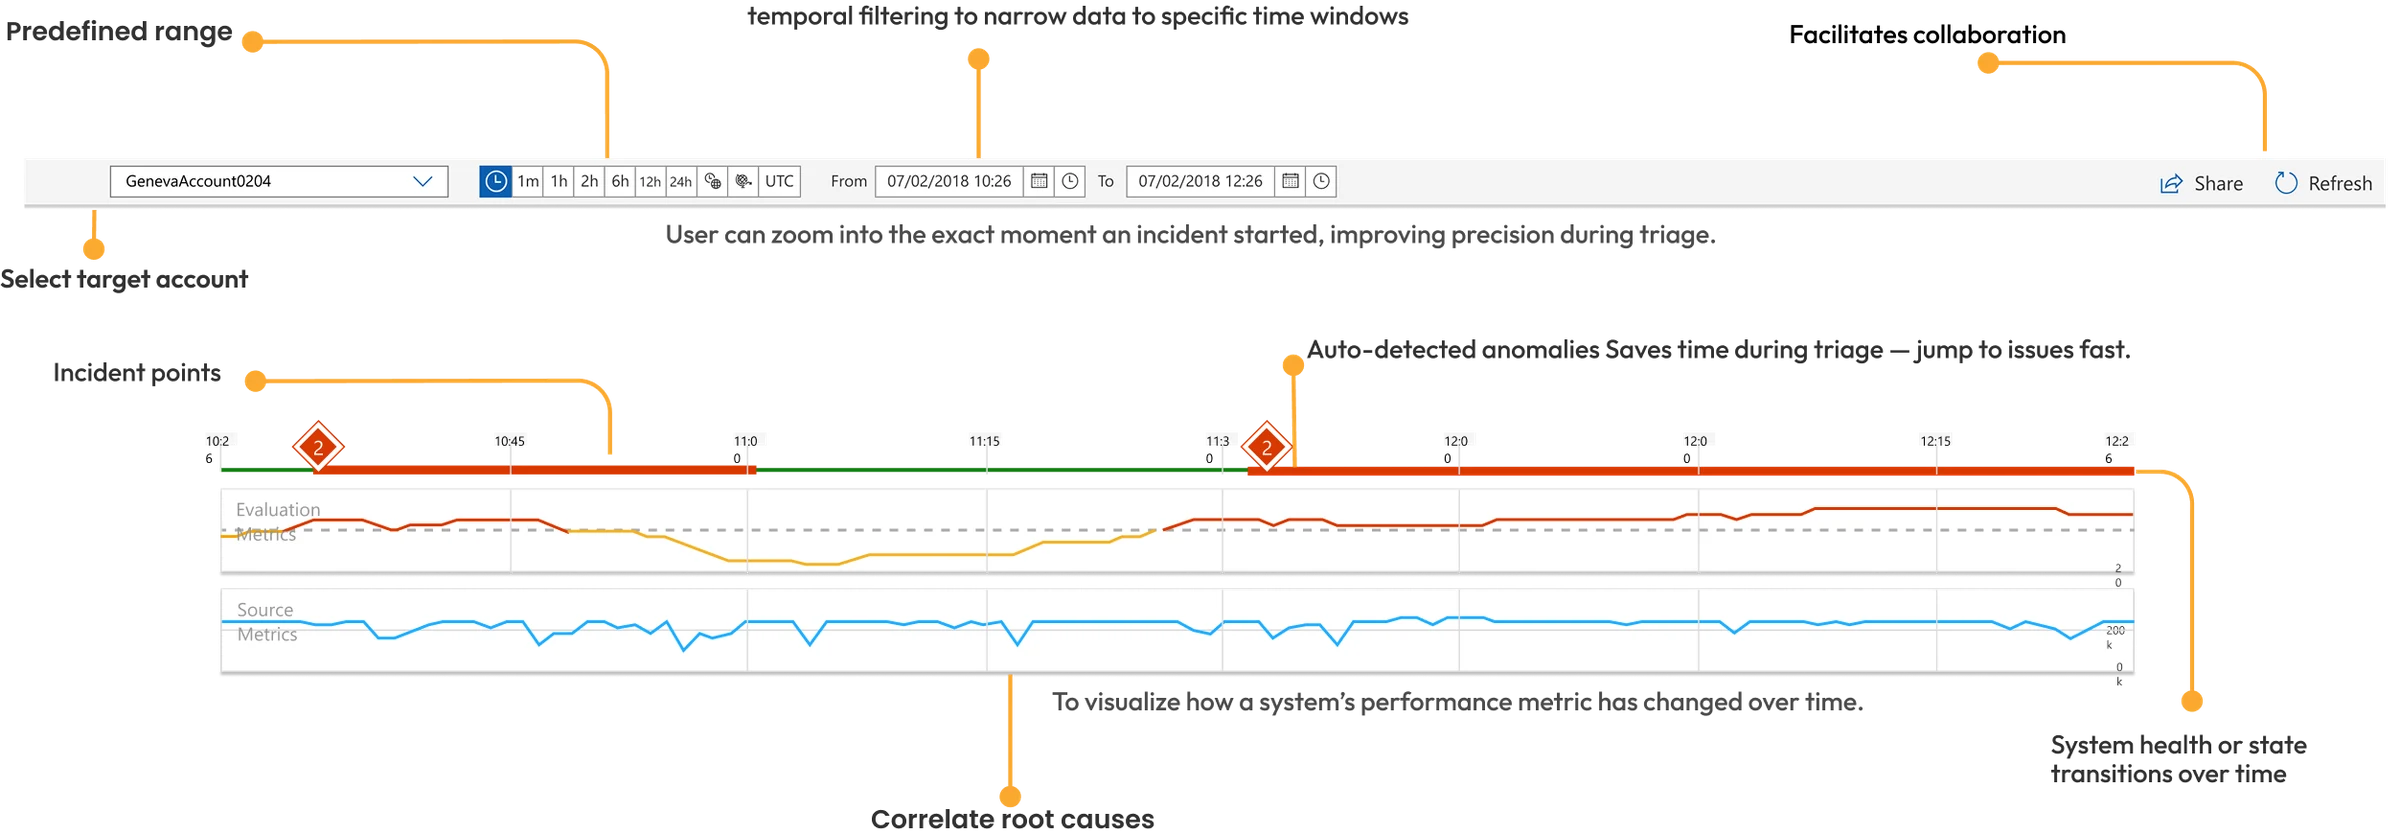
The unorganized display of filters made it difficult and time-consuming for users to scan through and enter input. This aligns with source monitoring theory — recall accuracy depends on tracking information origins. The timeline gave engineers a precise anchor point instead of an unorganized data dump.

Predefined range + temporal filtering — narrowed data to specific time windows. Engineers investigated the right moment, not the entire data history.
Auto-detected anomaly markers — incident points flagged automatically. Engineers jumped to issues fast instead of scanning for degradation manually.
Helped correlate root causes — Evaluation Metrics and Source Metrics on the same time axis. Engineers could see both metric types at once and spot when two problems lined up.
Facilitated collaboration — shareable timeline state meant engineers handed off the exact window, not a verbal approximation. "Look at 10:26–11:30" not "around that morning."
Event Viewer / Metric Timeline — architecture decision rationale
Design Decision 04
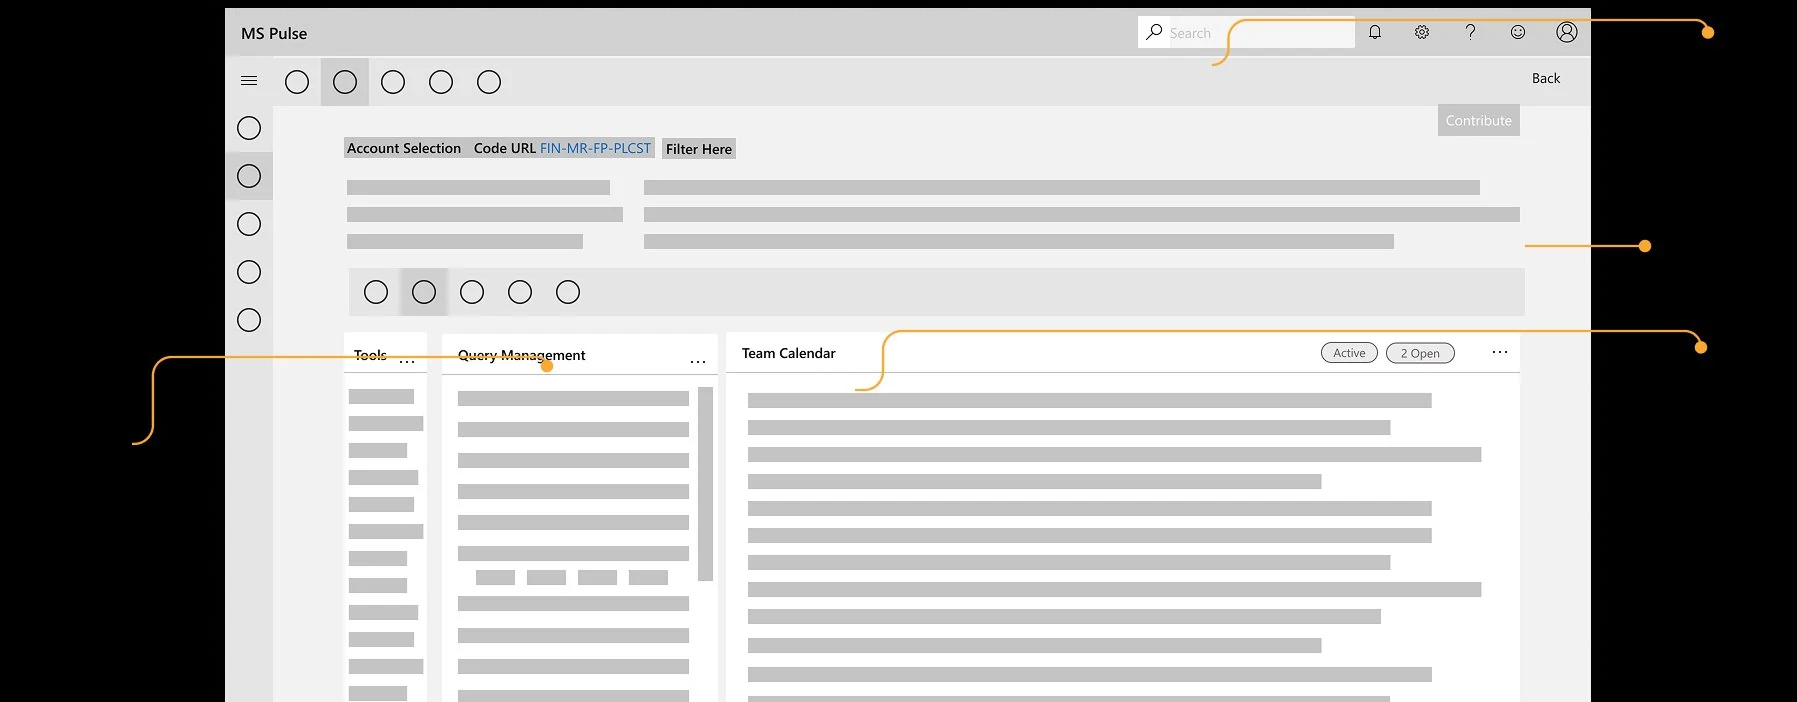
Single-Screen Control Center

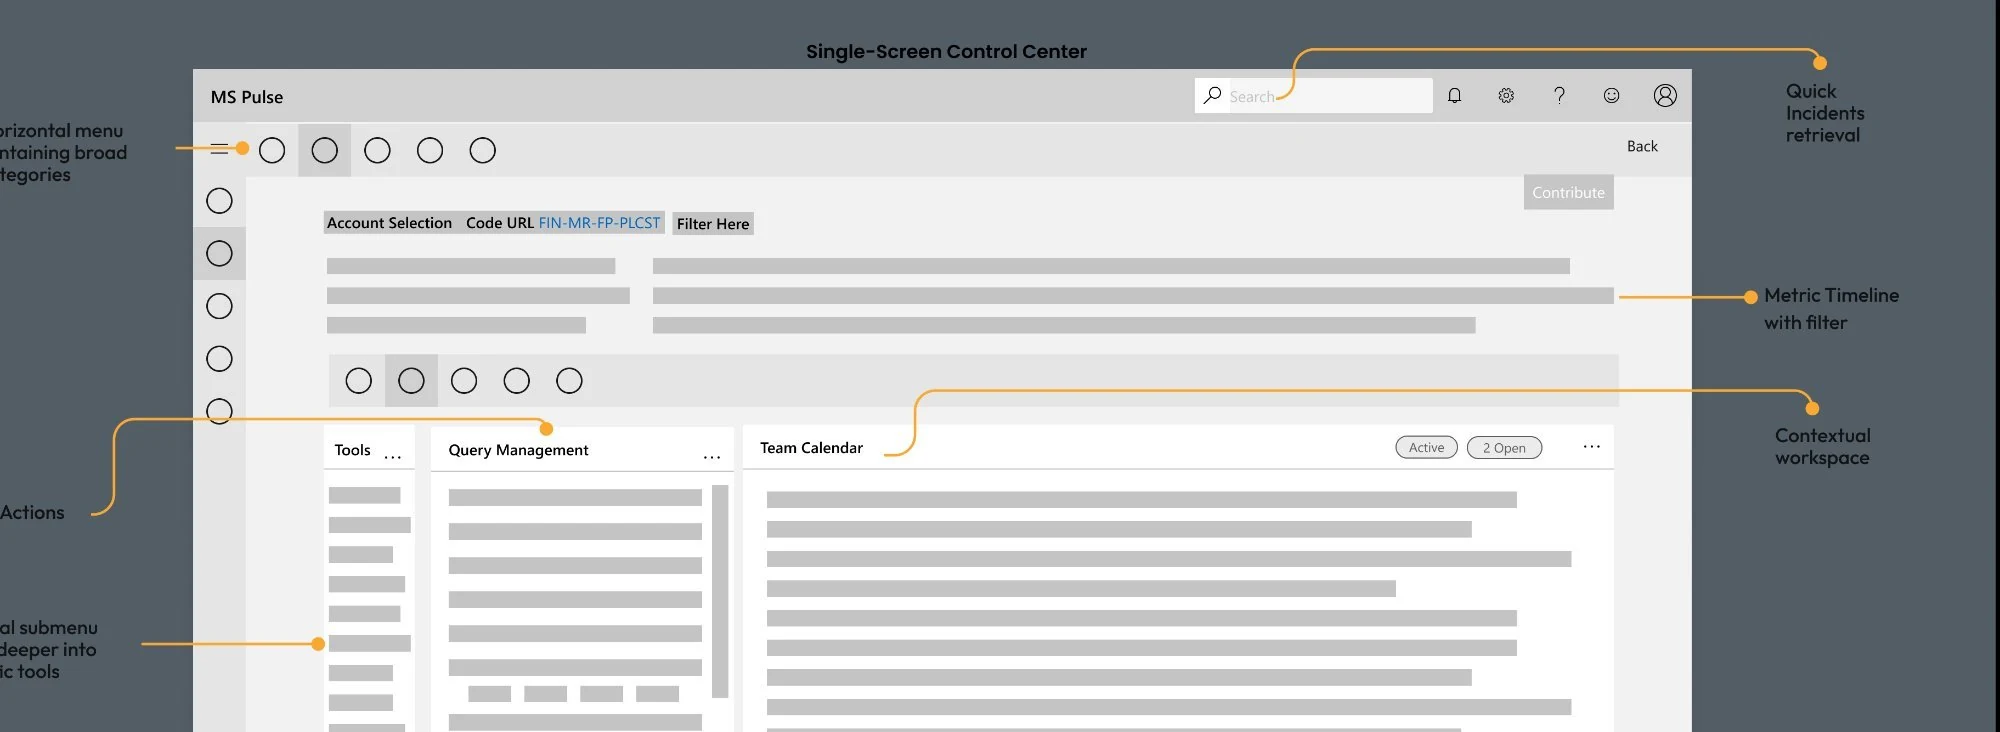
The architecture validation confirmed the core product bet: everything an engineer needed during an incident — navigation, filters, metric timeline, tools, query management, team calendar — accessible from a single surface without a context switch. This was the structural answer to the 63% problem.

Horizontal menu — broad categories on top with vertical submenu diving deeper into specific tools. Top-Left-Left pattern validated by speed study as fastest navigation model.
Metric timeline with filter — always visible at the top of the workspace. Engineers always knew which time window they were in while working in the tools below.
Contextual workspace — Tools, Query Management, and Team Calendar panels side-by-side. All three visible at once, with no tool switching.
Quick incidents retrieval — Search by Incident ID accessible from the top bar at all DM Sans. Jump to any incident without navigating.
Single-Screen Control Center wireframe, annotated: horizontal menu, metric timeline with filter, contextual workspace, quick incident retrieval
08
Iteration Process
Paper prototypes caught workflow gaps early; lo-fi confirmed the architecture before anything was built.
08 / Validation Gates
Three rounds before committing to build
Each round had a specific question. The answer to each either confirmed the direction or changed it. Nothing was committed to engineering until the relevant architectural question was answered with engineers, not assumptions.
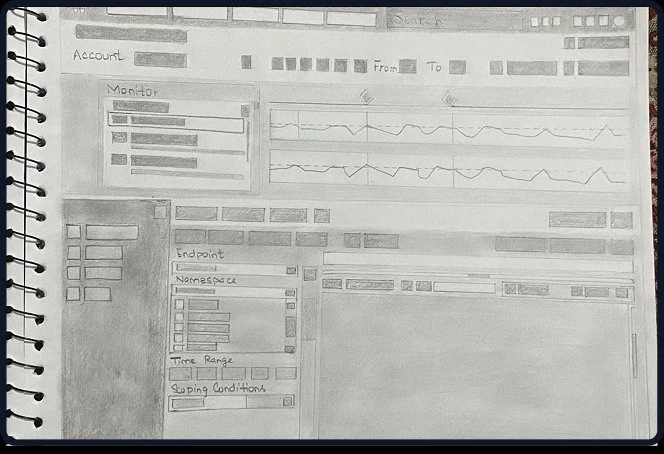
Gate 01 — Workflow validation before any digital work
Concept A — Platform onboarding
Early concept — Hub Alpha onboarding
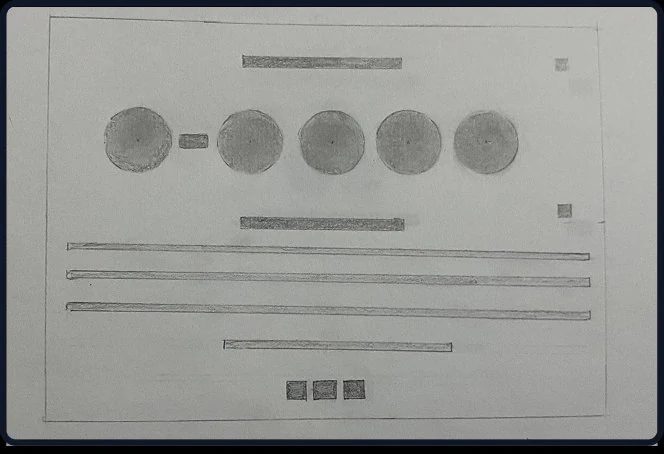
Early concept of the Hub onboarding — validated engineers understood the "one platform" model on first exposure before any engineering work was scoped.
Concept B — Diagnostic workspace
Early concept — diagnostic workspace
Diagnostic workspace concept. Three workflow dead-ends caught and eliminated before a single engineering story was written.
"Catching three dead-ends before we'd written a single engineering story was the cheapest possible failure. That's the point of the gate."
Discovery phase — gate review notes
Gate 02 — Single-surface architecture confirmed with engineers
Architecture validation concept
Architecture concept — unified Pulse surface
Unified surface concept — Tools, Query Management, Team Calendar in one view. Engineers confirmed this matched their actual incident workflow. Single-surface architecture locked before engineering sprint planning.
01
Gate 01 — 3 Workflow Dead-Ends Eliminated Pre-Build
Core workflows mapped with engineers before any stories were written. Three critical paths that would have required rework mid-sprint were caught and resolved before engineering capacity was committed.
3 dead-ends eliminated
02
Gate 02 — Single-Surface Architecture Confirmed
Engineers confirmed the composite view matched their incident workflow. Architecture locked before sprint planning began. No rework on the core surface model after this gate.
Architecture confirmed
03
Gate 03 — Filter Architecture Fully Restructured
Card sort: 11 of 12 engineers organized by environment anchor, not system module. Entire filter architecture rebuilt before engineering sprint started. No mid-sprint IA changes.
Filter architecture rebuilt
09
Delivery & Prioritization
What shipped in which sprint, what got cut, and why the sequence was deliberate.
09 / Sprints
Sequence was the strategy
I owned the backlog end-to-end — wrote user stories, set acceptance criteria, ran sprint reviews, and made scope calls when engineering capacity conflicted with feature completeness. The sequencing wasn't arbitrary. It was built around one principle: fix the architecture before building on top of it.
Definition of Done on this project included usability validation gates — no sprint closed without confirming the shipped feature reduced measurable friction for the target persona.

12 months. 3 engineering teams. The delivery sequence was the product strategy made operational — if the IA was wrong, everything built on top of it would inherit the problem.

S1–3
Foundation — IA restructure and navigation architecture
Card sort findings translated into new filter hierarchy. Top-Left-Left navigation layout from speed study implemented. No visible features shipped to end users in sprint 1 — entire sprint was architecture. Stakeholders wanted to "see something." I showed them the card sort and nav speed study results to explain why the foundation had to come first, before anything else could be built.
Architecture first
S4–6
Unified surface — single investigation workspace
Dashboard, Health, and DGrep accessible from one surface without full context reload. Context persistence across tool panels shipped. This was the direct response to the 63% finding — every sprint in this phase was measured against one metric: are engineers switching tools less? Acceptance criteria for every story included a specific observable behavior that we could validate in shadowing sessions.
Core value delivery
S7–9
Query memory — institutional knowledge encoded in the tool
Recent queries with DM Sanstamps. Suggested queries with match percentages and reasoning. This was the zero-query-memory finding made into a feature. Originally scoped for sprint 4 — pushed to sprint 7 because the unified surface architecture had to be stable first. A query panel built on a fragmented architecture would have inherited the context-loss problem we were solving. The delay was a scope call, not a slip.
Deliberate delay — right sequence
S10–12
Escalation context + proactive monitoring
Shareable DM Sanstamps and filter state for handoffs. Auto-detected anomaly surfacing. RCA documentation in-context. These features were sequenced last because they depended on the unified surface and query memory being in place — they were add-ons to a stable foundation, not structural work.
Additive on stable foundation
What got cut — and the reasoning

Custom dashboard builder — requested by senior engineers, deferred entirely. Build cost was 3 sprints. User research showed 8 of 10 engineers used the same 4 panels every incident. A configurability feature solving a preference problem was deprioritized against architectural work solving a business metric problem.

Slack integration for incident updates — deferred to post-launch phase. Would have required API work across 2 additional teams and introduced a dependency that could have blocked sprint 8. The escalation context feature already addressed the handoff problem within Pulse. Slack integration was nice to have, not need to have.

Success metric I owned

I defined MTTR reduction as the primary outcome metric at project kickoff — not post-hoc. Baseline was established from the same observational sessions that generated the 63% finding. Target was set at 25% reduction within 6 months of full rollout. Actual: ~30%.

Secondary metric: tool-switch frequency per incident session. Measured via session analytics added after launch. This was the leading indicator — if tool-switching dropped, MTTR would follow.

10
Pre-Ship Validation
Two rounds of testing on real incident scenarios, and what changed after each.
10 / Validation
Tested before shipping
Two rounds of moderated sessions with support and on-call engineers — against real incident scenarios, not hypothetical tasks. Each round had a pass/fail acceptance gate. Nothing moved to final engineering build without passing it.
Sessions were scenario-based. Engineers were given an active incident description and told to resolve it — then observed, not guided.

Two pre-ship validation rounds with L2/L3 support and on-call engineers — 60-minute sessions against real incident scenarios. Every round had documented outcome criteria. Every round changed something before the next sprint.
Format
60-min moderated sessions
5 L2/L3 Support and On-Call Engineers · Scenario-based, not task-based — given a live incident description and observed
Targets set
Task Success Rate ≥90%
Avg. Time on Task ≤60s
SUS Score ≥80
Core tasks tested
Locate high-priority alert · Filter by time range · Run saved DGrep query · Execute corrective action · Save custom view
F1
Filter Discoverability — Only 60% found the collapsed filter icon
The filter control was labelled "Control" with a small icon. 40% of engineers never found it during triage scenarios — they worked around it by using top-nav tabs instead, adding 3–4 extra clicks per incident.
Issue: "Control" label invisible under pressure
Only 60% initial discovery rate. Engineers under time pressure skipped it entirely.
Fix → Task success rate rose to 100%
Renamed to "Filters" with a prominent funnel icon and tooltip. Re-tested: 100% discovery, task time dropped 40% (75s → 45s).
F2
Saved Queries Visibility — 40% couldn't locate recent queries
Recent queries were buried in a submenu. 2 of 5 engineers rebuilt queries from scratch during testing — exactly the behavior the feature was designed to eliminate. The panel existed but wasn't being found.
Issue: Recent queries buried in submenu
40% of engineers defaulted to rebuilding — the exact overhead the design was meant to eliminate.
Fix → "Recent Queries" promoted to top-level
Elevated to primary navigation. In round 2, 5 of 5 engineers opened Recent Queries instead of rebuilding — engineers using the memory feature as intended.
F3
Action Panel Engagement — Engineers hesitated to expand slide-in panel under pressure
The Actions panel was a slide-in drawer. Under incident pressure, engineers didn't want to "lose" their current view to open it — so they avoided it entirely, using bookmarks and workarounds instead.
Issue: Slide-in panel felt risky under pressure
Engineers feared losing their diagnostic context. Avoidance behavior observed in majority of sessions.
Fix → Persistent "Quick Actions" on dashboard
Always-visible Quick Actions button added directly on the main dashboard. Eliminated avoidance — engineers acted without leaving context.
Task Time
−40%
Avg. task time dropped from 75s to 45s — inside the ≤60s target per incident action
SUS Score
85
Improved from 68 — indicating a highly usable and learnable interface. Target was ≥80.
Task Success
100%
After iterations, all core tasks completed successfully. Surpassed the ≥90% target across all 5 test scenarios.
11
Completed Application
From architecture decisions to a shipped, production-ready platform
11 / Final Product
The Hub Alpha — Shipped
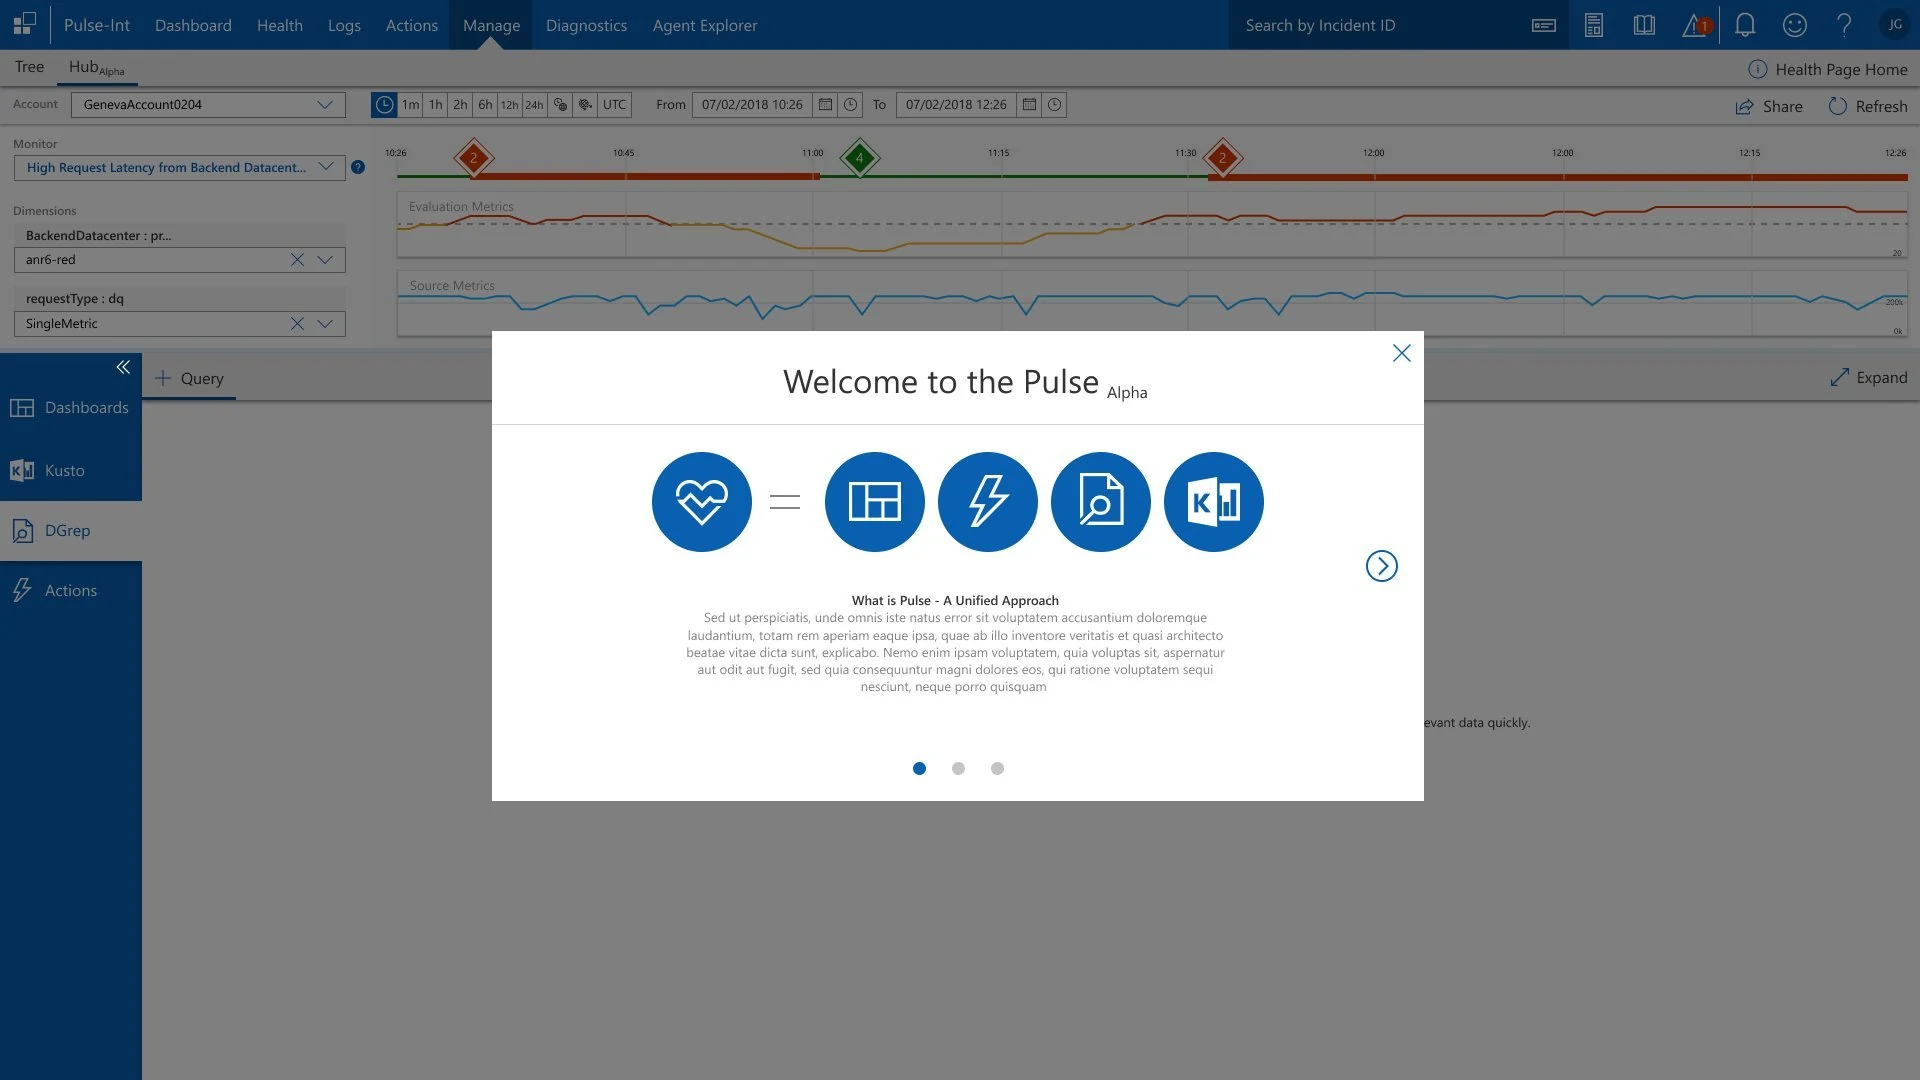
The completed platform unified Dashboards, Kusto, DGrep, and Actions behind a single interface. The coachmark onboarding system introduced the unified approach to engineers on first use — positioning Pulse not as five tools but as one coherent workspace.
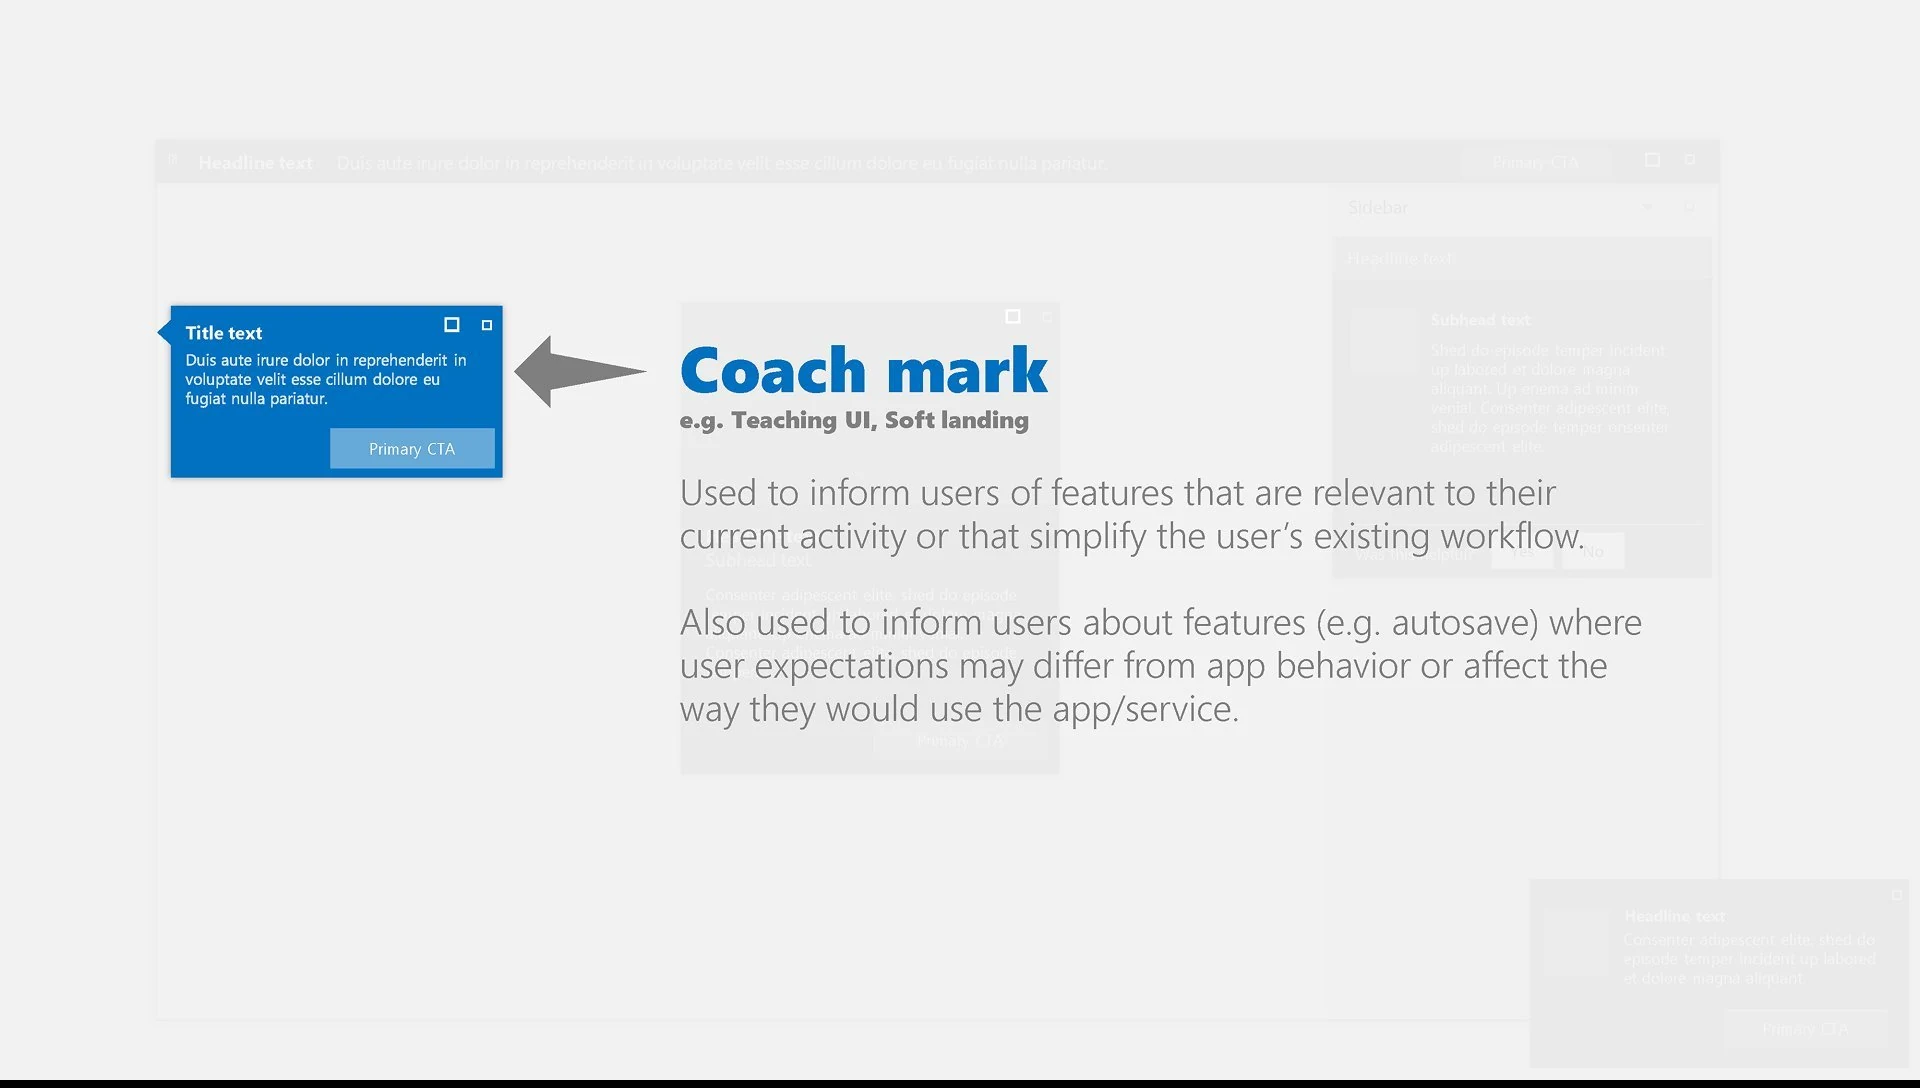
Both onboarding slides are context-aware coach marks — appearing only on first login, and never popping up in the middle of a live incident.
Onboarding — Coachmark System in Production
Completed app — Welcome to Pulse Alpha modal showing unified tool icons
Welcome to Pulse Alpha — first-login coach mark introducing the unified approach: Pulse = Dashboard + DGrep + Health + Kusto + Actions. Paginated 3-slide introduction.
Completed app — Pivot Between Tools onboarding slide
Slide 2: "Pivot Between Tools" — contextual diagram showing the interconnected tool architecture. Engineers understood the mental model before their first live incident.
Completed Feature — DGrep Query Discovery
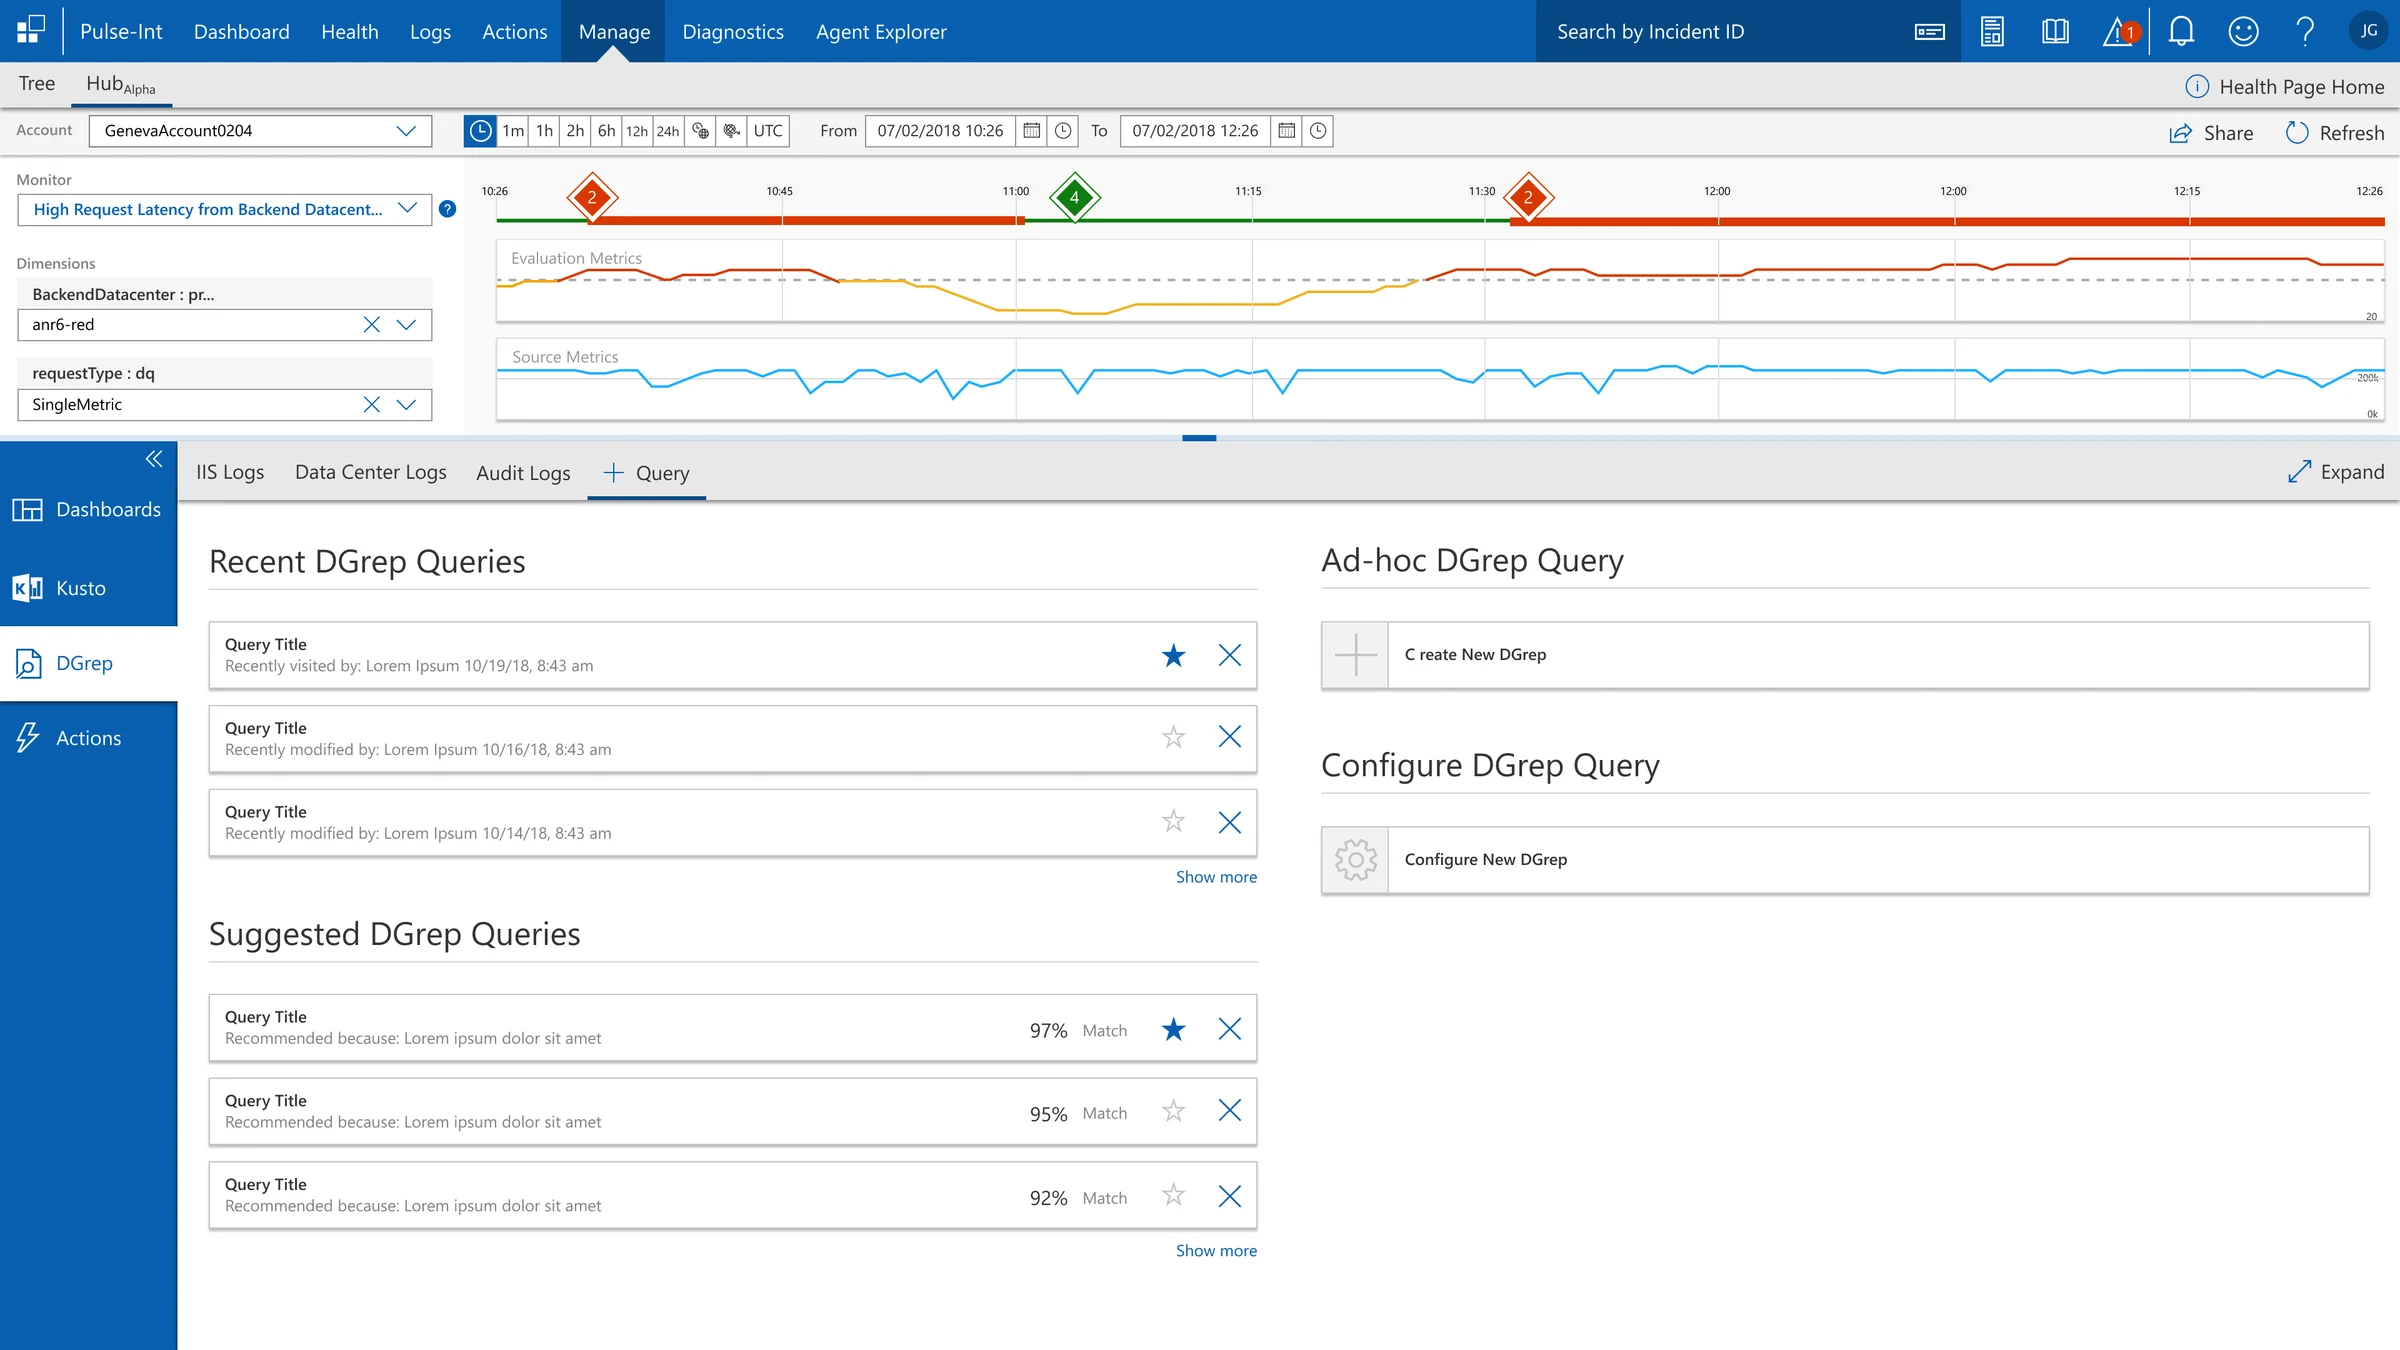
Recent Queries · Suggested Queries · Ad-hoc Creation · Configure

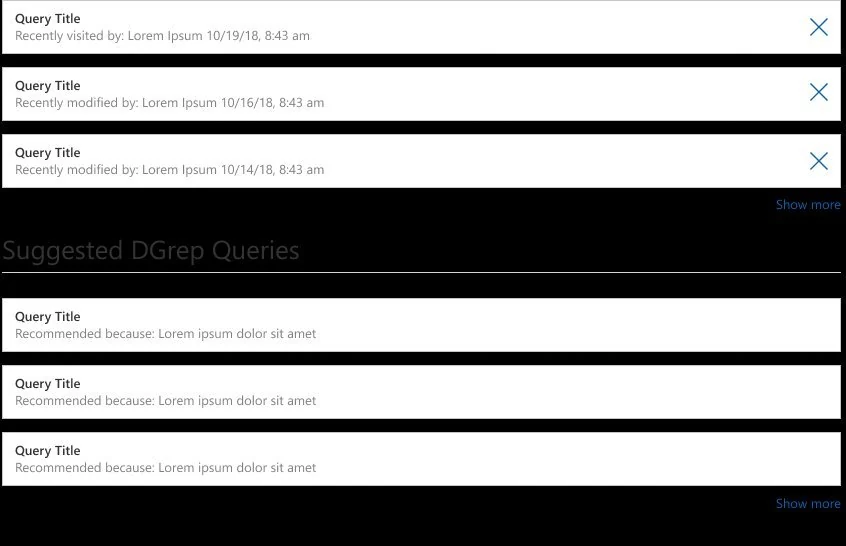
The fully shipped Query panel. Recent DGrep queries with DM Sanstamps and star/dismiss controls. Suggested queries with match percentage scores (97%, 95%, 92%) and "Recommended because" reasoning. Ad-hoc creation and Configure options on the right. Every element traced directly to the "zero query memory" research finding.

Completed DGrep query panel — Recent, Suggested, Ad-hoc, Configure
Recent DGrep Queries — DM Sanstamped (10/19, 10/16, 10/14) with recently visited / recently modified metadata. Star to save, × to dismiss. Team knowledge lived in the tool again, not just in people's heads.
Suggested Queries with match scores — 97%, 95%, 92% Match. Context-aware recommendations based on current incident. Engineers started from a relevant baseline, not a blank field.
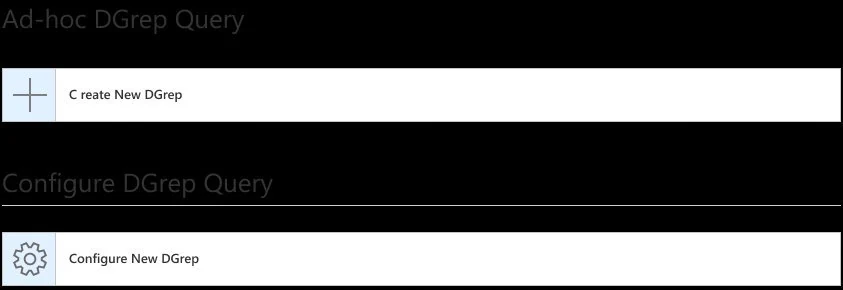
Ad-hoc + Configure — power users could create or reconfigure queries without leaving the panel. Full flexibility preserved alongside the memory system.
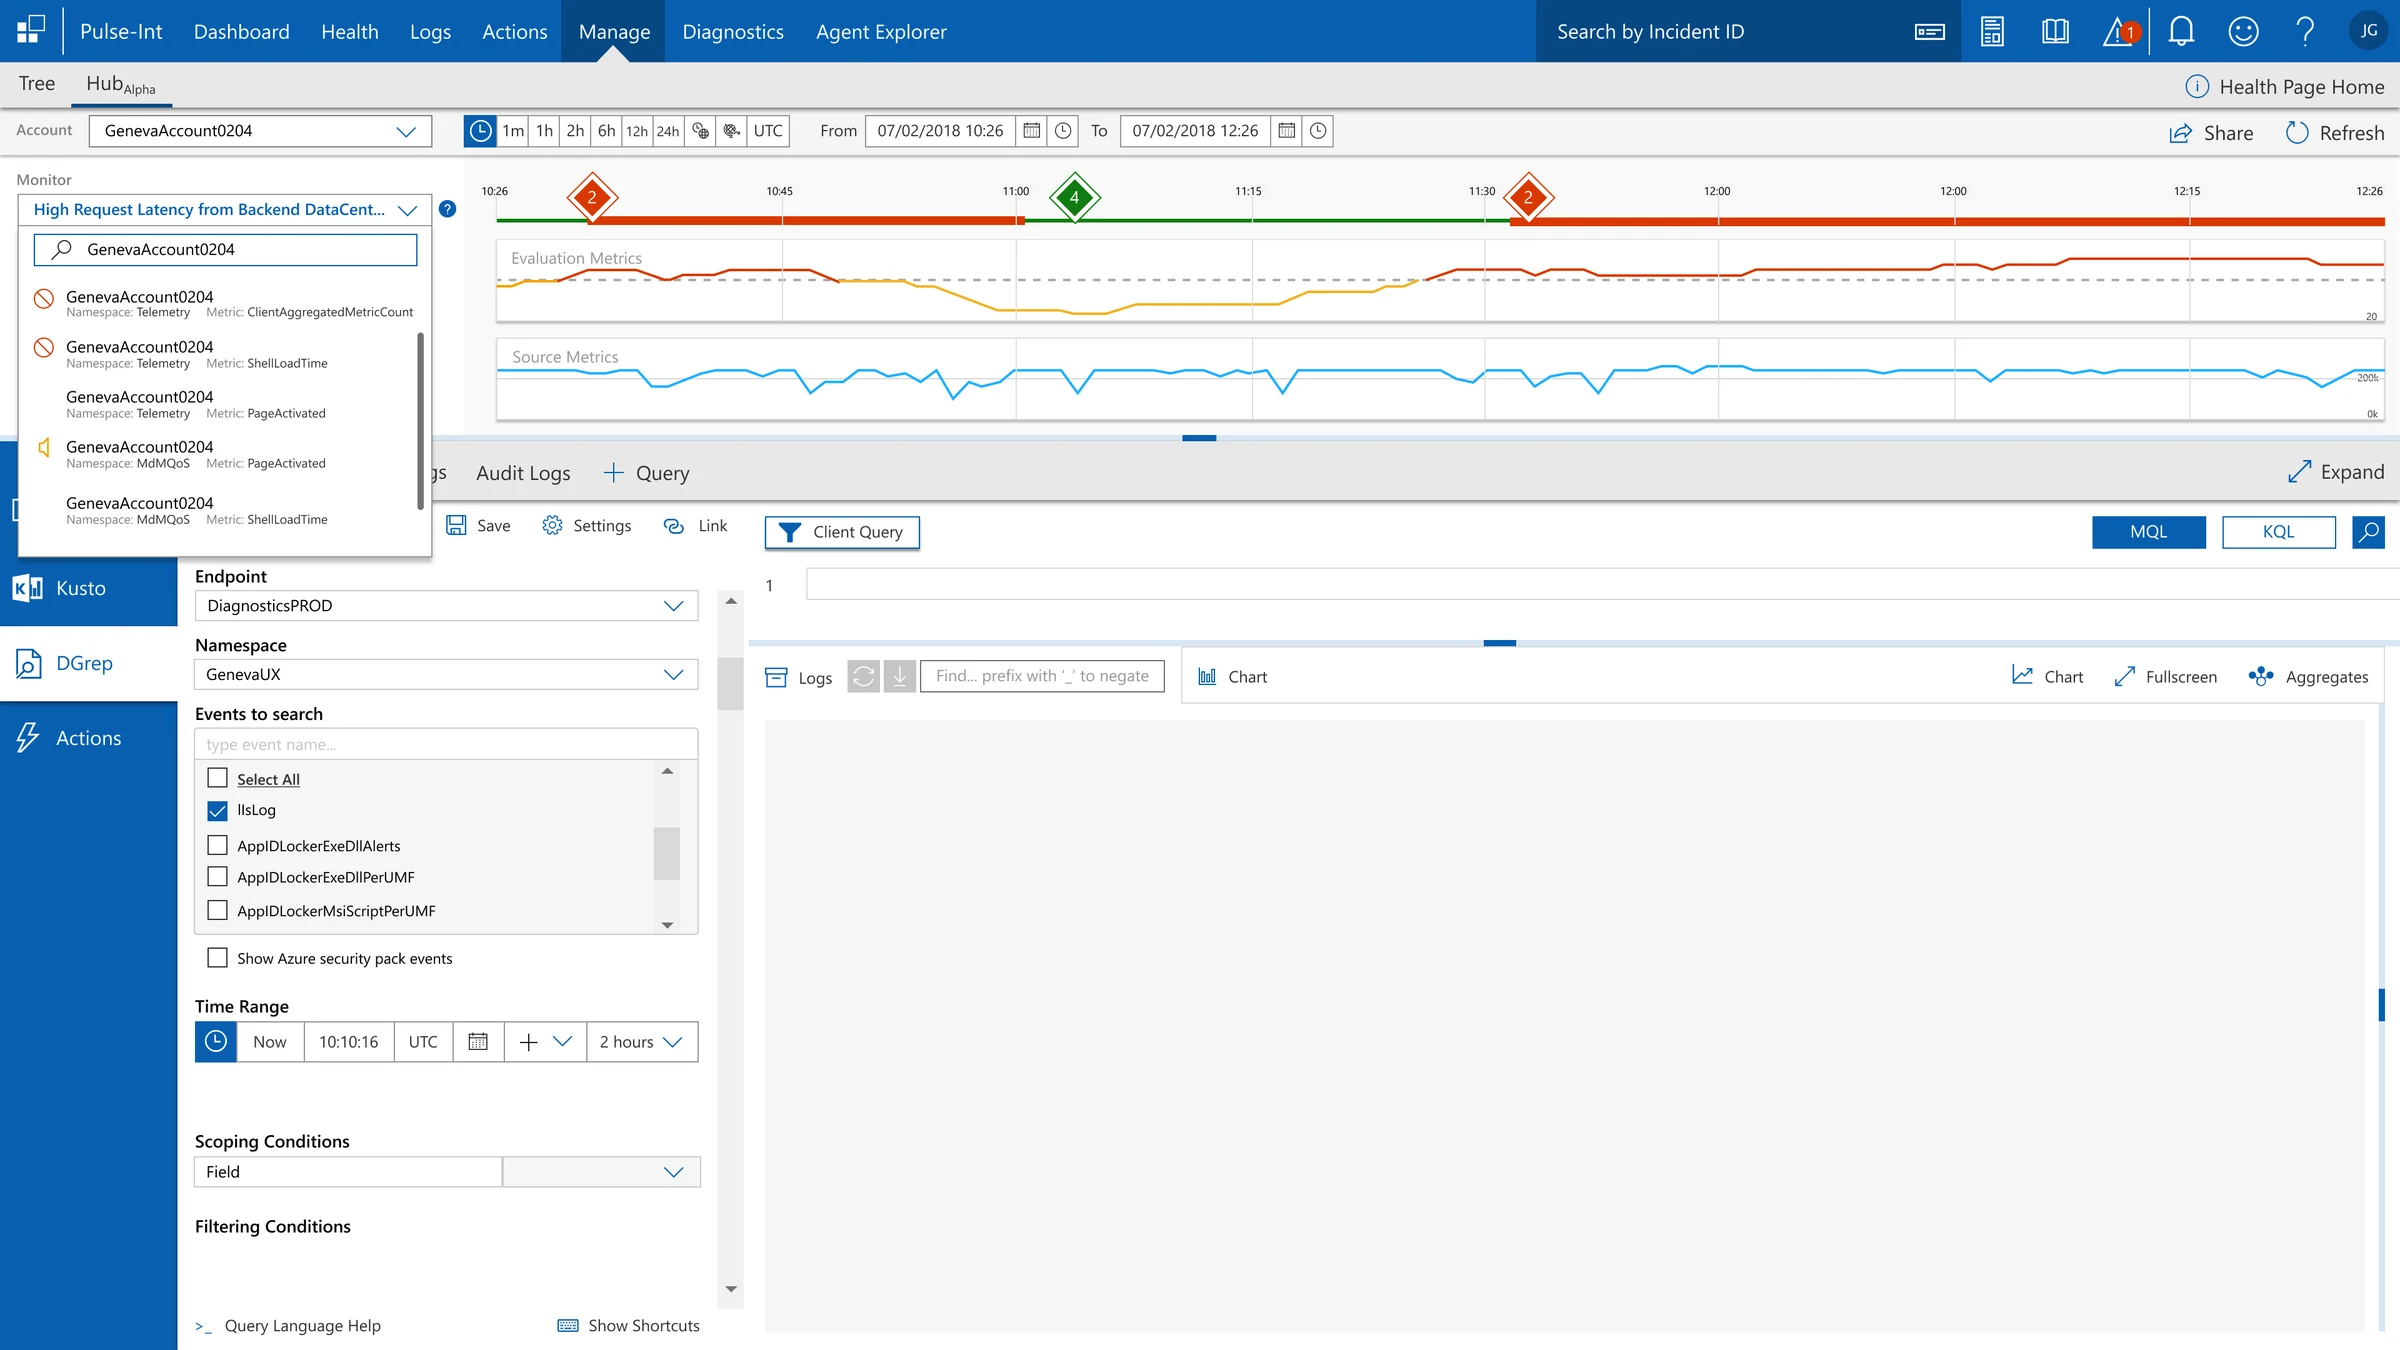
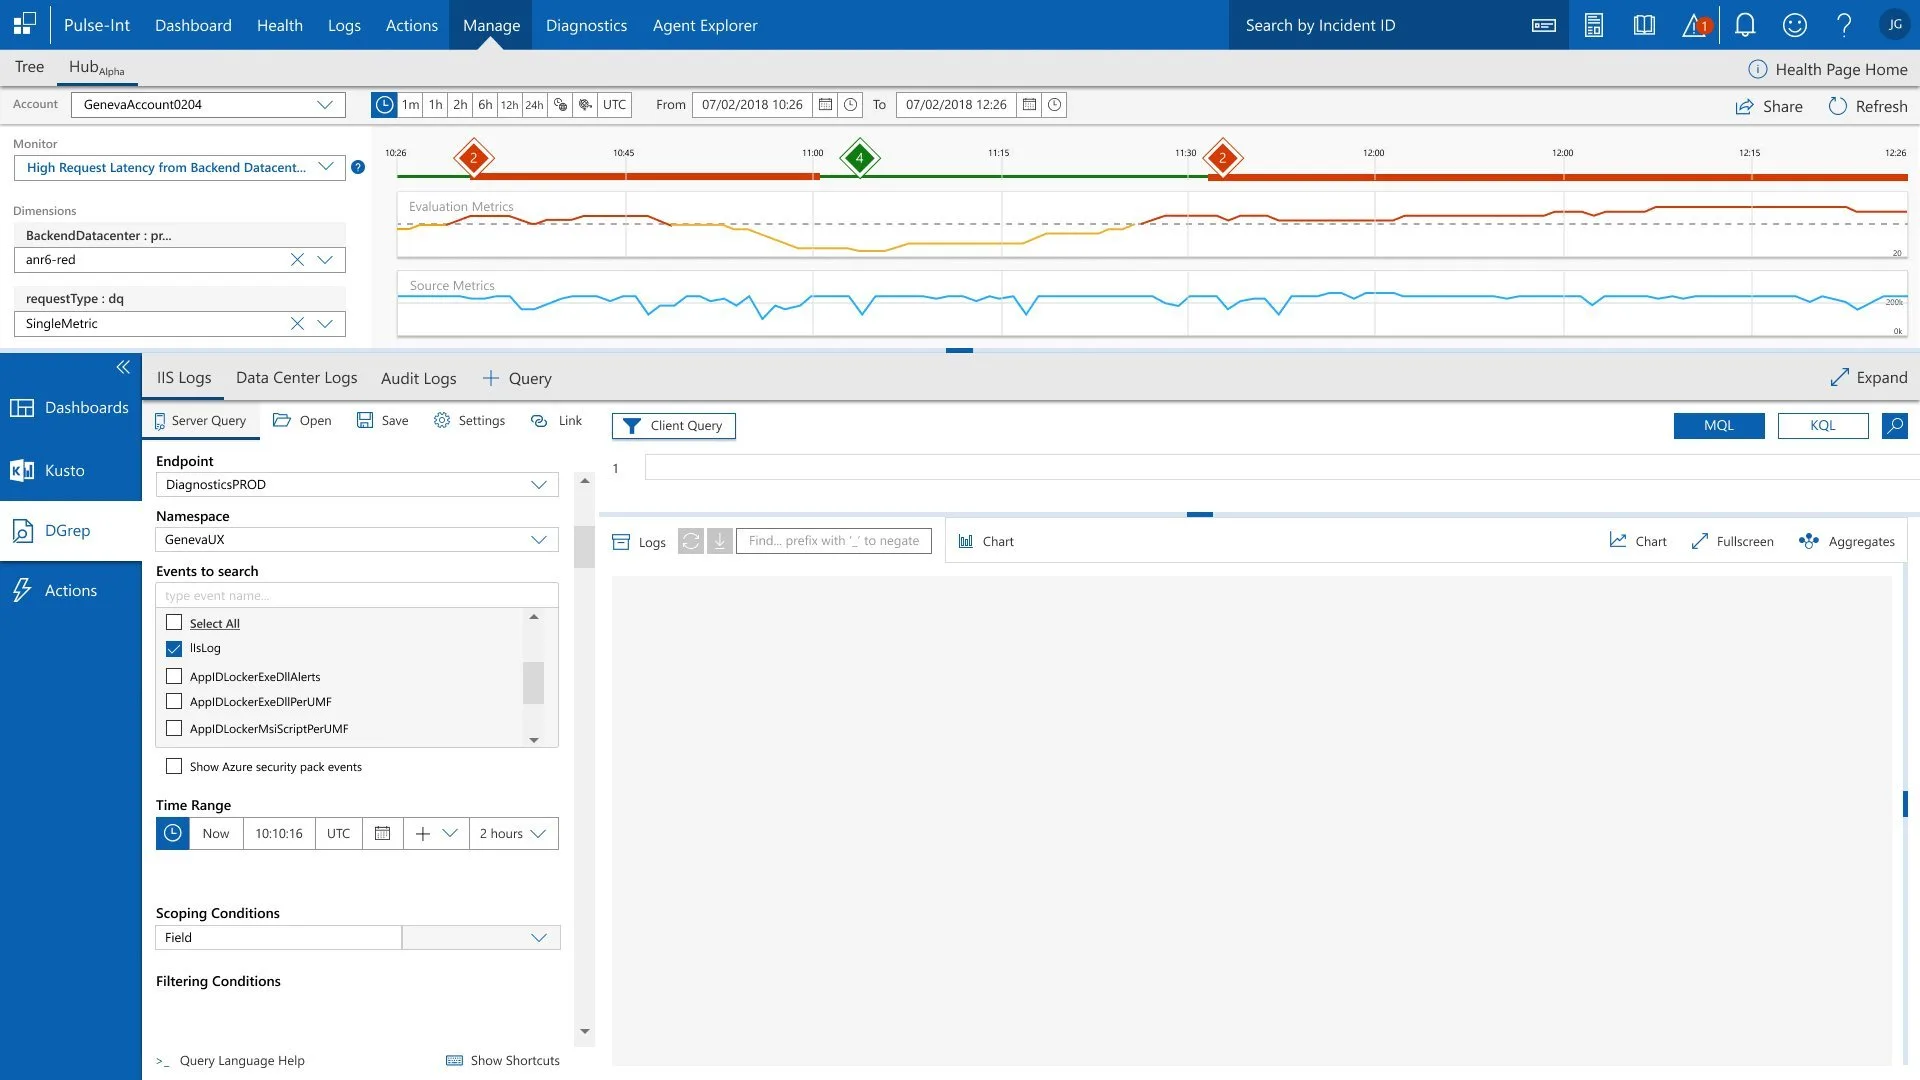
Completed Feature — Unified Diagnostic Workspace
Account → Monitor → Dimensions → Server Query — One Screen

The shipped workspace showing the full diagnostic context simultaneously: Account selection (GenevaAccount0204) with live monitor dropdown, Dimensions filters (BackendDatacenter, requestType), metric timeline with incident markers, and the complete Server Query panel (Endpoint, Namespace, Events, Time Range, Scoping, Filtering) — all previously requiring 3+ separate tools.

Completed app — full diagnostic workspace with Monitor dropdown showing GenevaAccount results
Monitor dropdown with live search — GenevaAccount0204 search surfaced Telemetry, MdMQoS, and PageActivated metrics instantly. Environment-anchor architecture from the card sort in action.
Timeline always visible — incident markers (2, 4, 2) remained in context while engineers configured filters below. Engineers never lost their place in time while setting up the workspace.
IIS Logs · Data Center Logs · Audit Logs · Query tabs — all log types accessible from one panel. No tool switching to access different log sources.
Completed Feature — Server Query + Client Query
Endpoint, Namespace, Events, Time Range, Scoping — unified in the diagnostic workspace

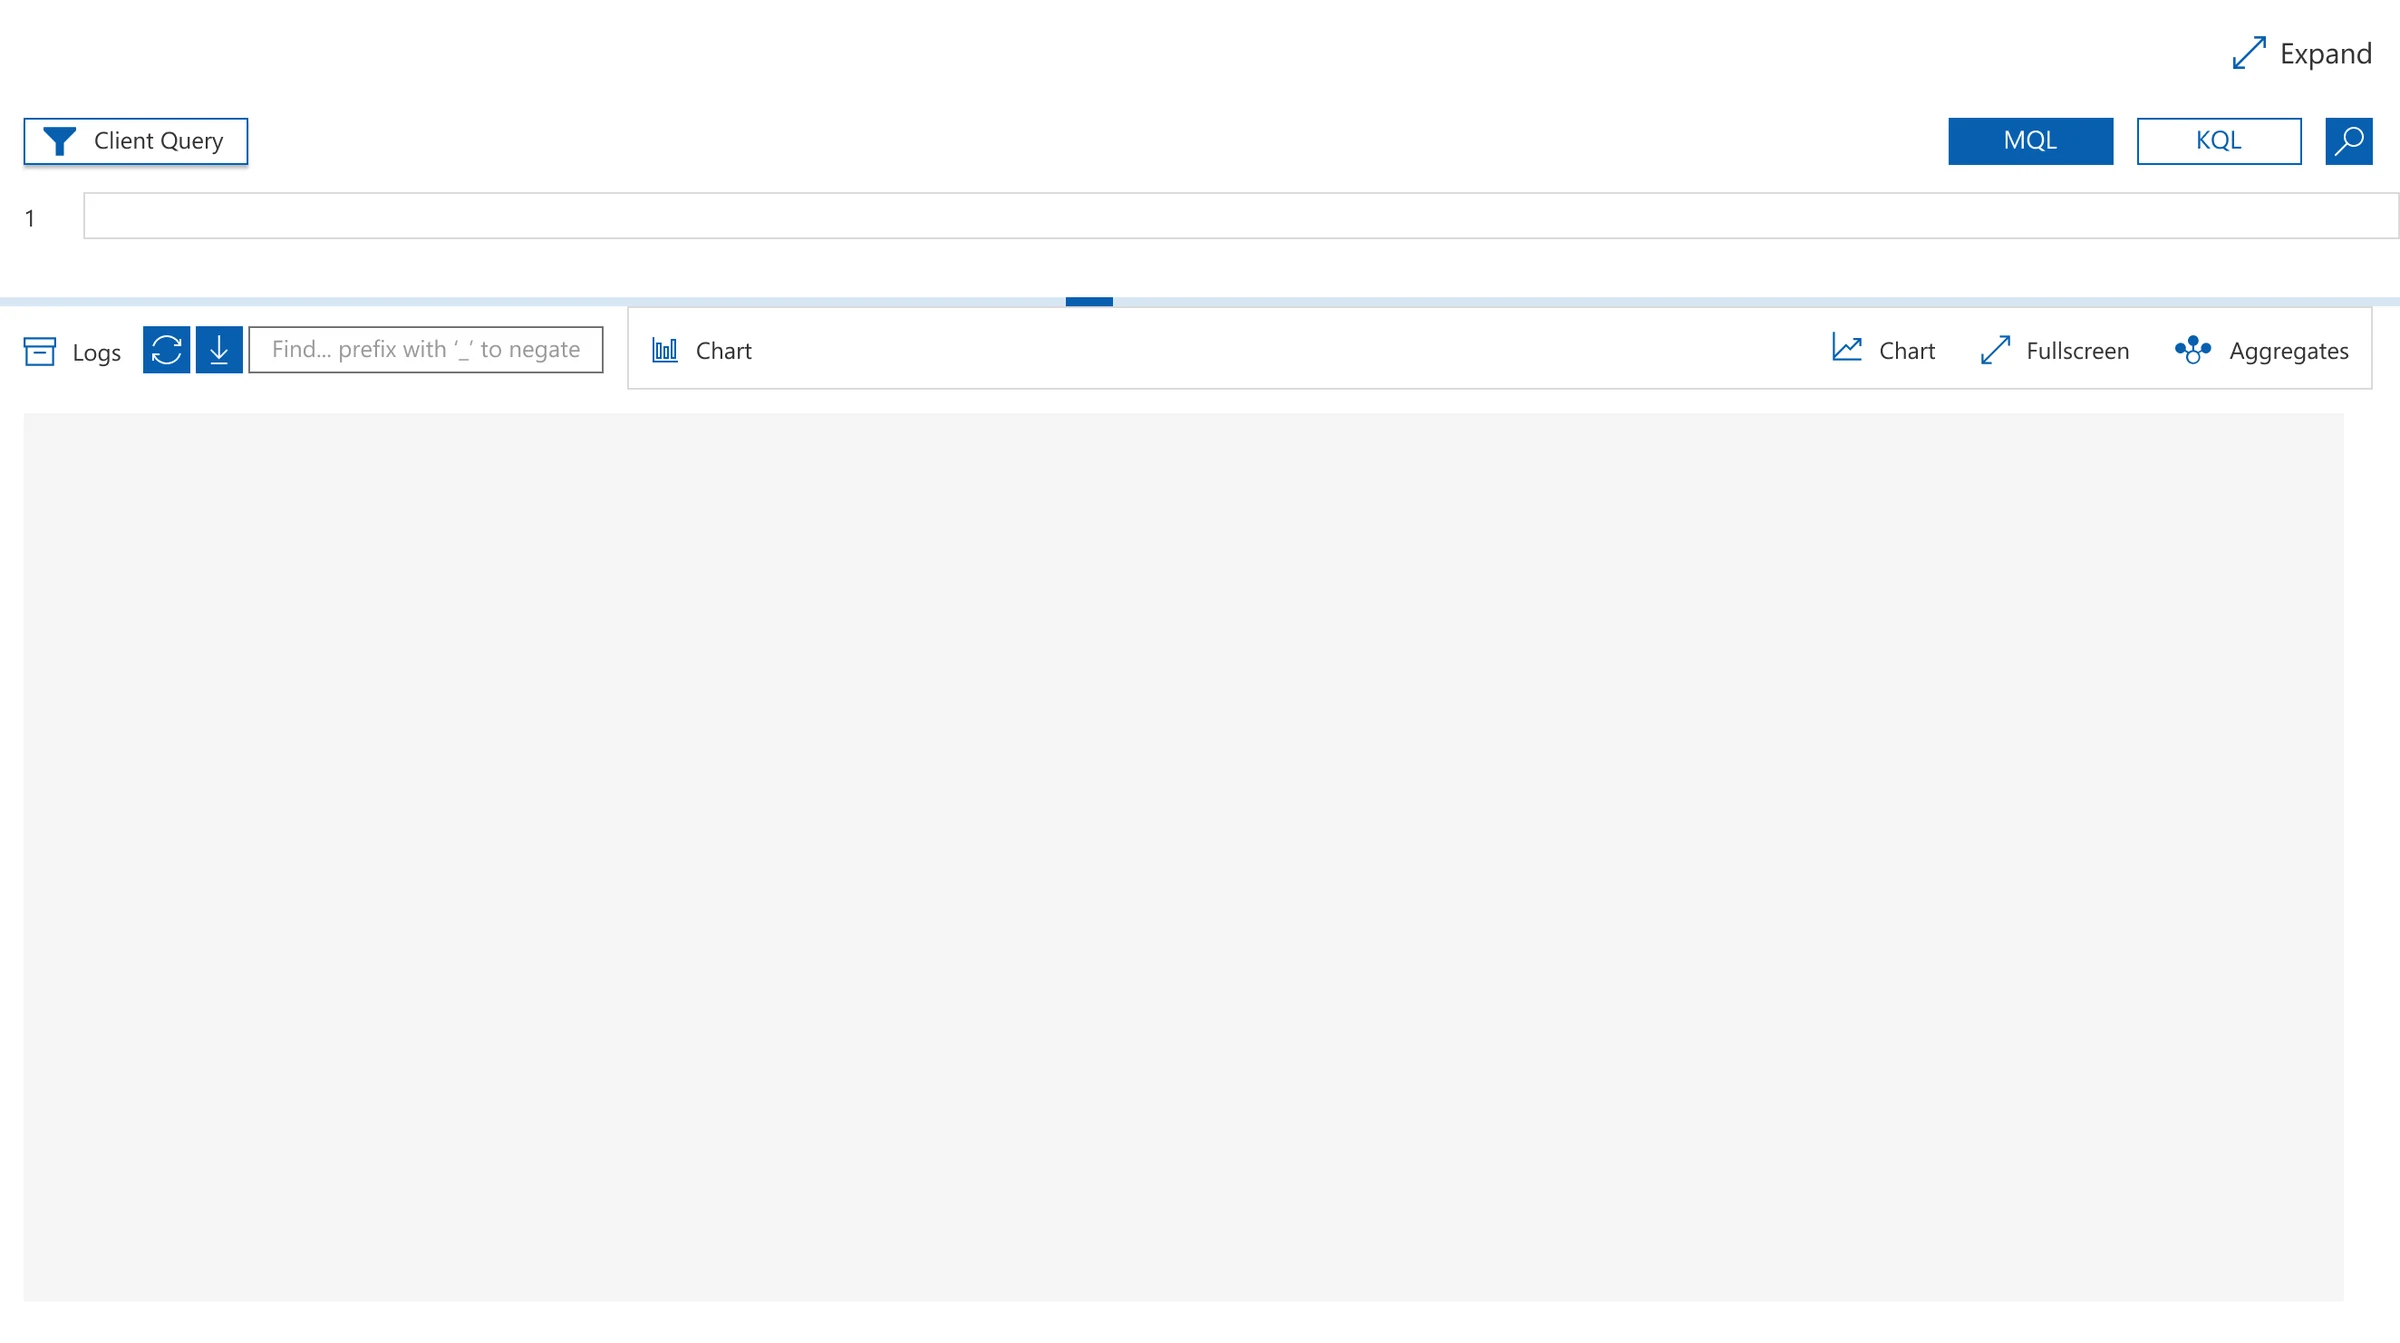
The complete Server Query panel alongside the Client Query workspace. Engineers configure DiagnosticsPROD endpoint, GenevaUX namespace, IlsLog event selection, Time Range (Now + 2 hours UTC), and Scoping Conditions — then switch to MQL or KQL for query execution. The full investigation lifecycle without leaving the screen.

Completed app — Server Query panel with full configuration and Client Query workspace
Server Query + Client Query side by side — configure the query parameters on the left, write and execute in the query editor on the right. No tool switch between configuration and execution.
MQL / KQL toggle — engineers worked in their preferred query language without friction. Power user flexibility preserved in the unified workspace.
Logs · Chart · Fullscreen · Aggregates — multiple result views accessible from the same panel. Engineers pivoted between visualization modes without navigating away.
Full Design System — All Screens

Every screen below mapped directly to a documented research finding. Nothing designed speculatively.

Event Viewer / Metric Timeline


Metric timeline — dual metric tracks with numbered incident markers
Event Viewer — Evaluation Metrics (yellow/red with threshold) + Source Metrics (blue) on shared time axis. Numbered incident markers (2, 4, 2) pinpointed degradation windows for immediate jump-to navigation.
Time range filter bar — granularity controls and share button
Time range controls — 1m/1h/2h/6h/12h/24h + custom UTC range + Share button. Engineers handed off "10:26–11:30" not "around that morning."
DGrep Query Discovery
Client Query — inline syntax hint embedded in search field
Client Query — "prefix with '_' to negate" embedded directly in the search field. Eliminated documentation tab-switching mid-incident.
Recent DGrep queries and Suggested queries panel
Recent Queries (DM Sanstamped 10/19, 10/16, 10/14) + Suggested Queries with match percentages. Institutional knowledge encoded in the surface, not individual heads.
Ad-hoc DGrep and Configure DGrep options
Ad-hoc + Configure options — power users create or extend queries without leaving the panel. Full flexibility preserved alongside the memory system.
Contextual Onboarding System
Live coachmark — Did you know tooltip in context
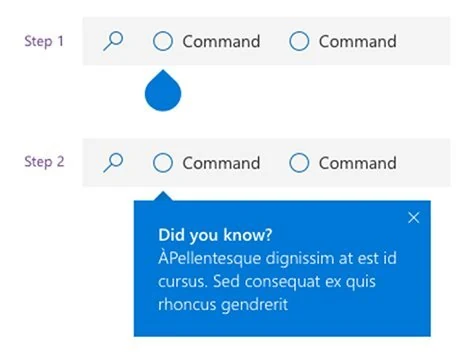
Live coachmark — "Did you know?" targeting a specific UI element in active context. Two-step progression. Delayed to post-first-incident based on R2 testing feedback.
Notification pattern — including in-app survey
Notification pattern — P2P, transactional, and subscribed events. In-app survey trigger for context-aware feedback collection without leaving the platform.
12 — Business Impact & Outcomes
What changed after launch.

Tool-switching dropped. Resolution time dropped. Engineers stopped rebuilding queries from scratch because the tool now remembered what they'd done before. The architectural fix the research demanded got shipped, and the business metrics that triggered the investigation reflected it. We measured this through internal incident telemetry and post-release observation sessions, comparing resolution DM Sans and tool-switch frequency across comparable incident categories before and after launch.

~30%
MTTR Reduction
Mean Time to Resolution cut ~30% in live environments — measured via internal incident telemetry comparing resolution DM Sans across comparable incident categories pre- and post-launch.
2.3×
Increase in Diagnostic Tool Return Rate
Post-launch usage showed 2.3× increase in engineers returning to the same diagnostic tools within a session — confirming trust in results rather than abandoning and tool-switching as before.
5→1
Tools Consolidated to One Surface
Design goal achieved: all diagnostic tools unified into a single screen. Engineers no longer required to leave the workspace to access Health, DGrep, Kusto, or Actions — the architectural fix the research demanded.
↓
Cognitive Load & Escalation Time
Consistent system, logical IA, zero-click access — reduced fatigue during SLA-critical incidents. Handoff context preserved, eliminating rebuild time at every escalation boundary.
"The saved filters and query memory are game-changers. I no longer waste time rebuilding DGrep searches from scratch at the start of every single incident."
Support Engineer · post-launch feedback session
"Finally, a unified view. Health alerts, DGrep logs, and Actions are all in one place. No more juggling between five different windows during a critical outage."
On-Call Engineer · usability validation
"Centralizing workflows cut our triage time in half. I can query logs and automate alerts within seconds — not the minutes it used to take just to find the right tool."
Senior Engineer · post-deployment survey
"Filters actually work the way I think. The flexibility to save custom workflows is brilliant — this is what I needed three years ago."
Support Engineer · ongoing feedback channel
← Back to Work